Monitoring global traffic can be challenging in large network deployments, where traffic crosses many accounts, AWS Regions, and teams. With AWS Cloud WAN, that traffic already passes through one core network that connects your VPCs and on-premises sites. Until now, though, seeing it at the flow level meant turning on Amazon Virtual Private Cloud (Amazon VPC) Flow Logs in each VPC and correlating the records yourself. Traffic between hybrid attachments, such as AWS Direct Connect, AWS Site-to-Site VPN, and Connect attachments, never reaches a VPC, so VPC Flow Logs can’t capture it.
Today we’re announcing AWS Cloud WAN Flow Logs. From the account that owns your core network, you capture flow logs for the traffic that crosses it. Every record includes the source and destination Region, segment, and attachment. You can publish them to Amazon CloudWatch Logs, Amazon Simple Storage Service (Amazon S3), or Amazon Data Firehose. You then analyze them with Amazon Athena or Amazon CloudWatch Logs Insights.
This 300-level post is for network administrators familiar with AWS Cloud WAN segments and attachments. It shows how to create flow logs at each scope and query them for cross-segment traffic, cross-Region traffic, and drops.
Key benefits
AWS Cloud WAN Flow Logs give you the following benefits:
- One view of your global network. Monitor traffic between VPCs, Regions, and on-premises networks connected through AWS Direct Connect, AWS Site-to-Site VPN, or software-defined WAN (SD-WAN).
- AWS Cloud WAN context in every record. Find out how much traffic moves between segments or Regions from a single query or dashboard.
- Service insertion and NAT context. Records show which inspection attachment a flow passed through and, with 1:1 network address translation (NAT), the translated address next to the original one.
- Drop reasons. Records show when and why AWS Cloud WAN drops a packet, complementing your attachment-level Amazon CloudWatch metrics. For examples, refer to the Pinpoint routing issues section.
How AWS Cloud WAN Flow Logs work
You create a flow log at one of three scopes. Resource type values are case sensitive.
| Scope | --resource-type | Resource ID | What it captures |
| Core network | CoreNetwork | core-network-0123456789abcdef0 | Every attachment on the core network |
| Core network edge | CoreNetworkEdge | core-network-0123456789abcdef0/us-east-1 | Every attachment at the core network edge in one AWS Region |
| Attachment | CoreNetworkAttachment | attachment-0aaaaaaaaaaaaaaa1 | One attachment |
Create an edge-scope flow log for each edge you monitor. Each record describes one flow through one attachment in one direction over a 1-minute interval.
You can create flow logs for VPC, Site-to-Site VPN, Direct Connect gateway, Connect (GRE), and AWS Transit Gateway peering attachments. Flows for a tunnel-less Connect attachment appear on its transport attachment, and flows for a Transit Gateway route table attachment appear on the peering attachment.
You manage all flow logs for a core network in the AWS Cloud WAN home Region: US West (Oregon) (us-west-2) for commercial Regions, or AWS GovCloud (US-West) (us-gov-west-1) for AWS GovCloud (US). AWS Cloud WAN publishes the logs from that Region.
The following figure shows the three scopes and their destinations.
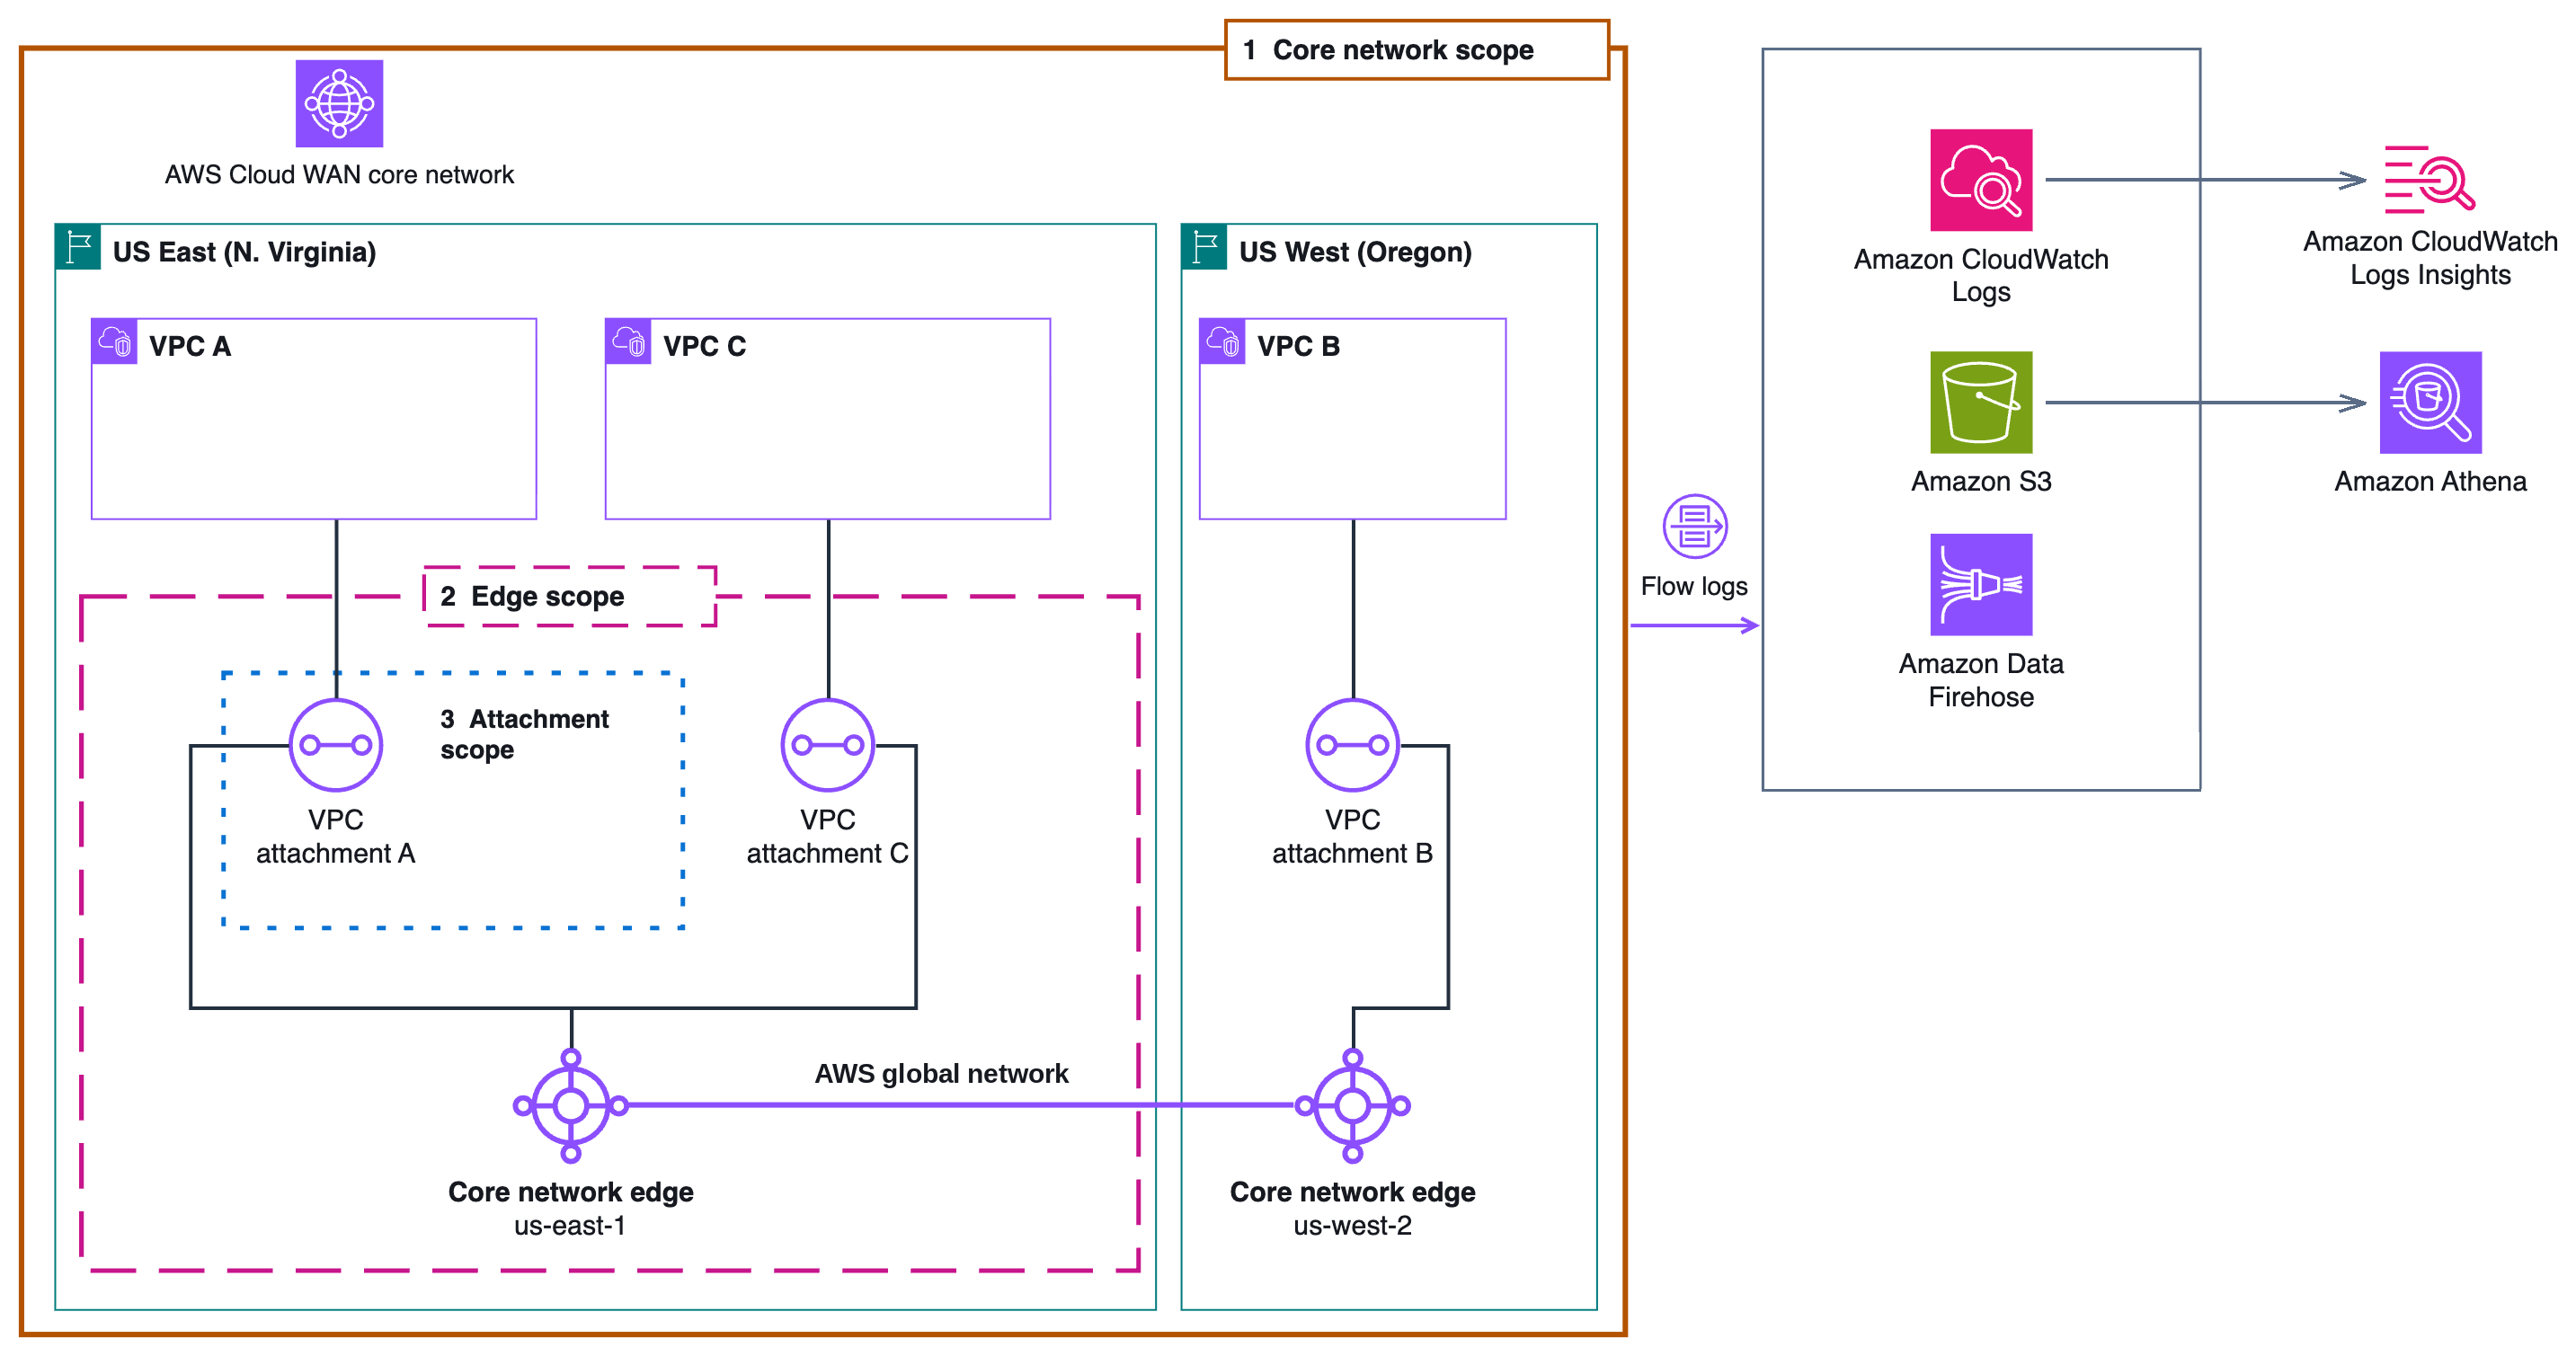
Figure 1: AWS Cloud WAN Flow Logs scopes and destinations.
What’s in a flow log record
The default format has 42 fields, delivered as one space-separated line per record. The following table describes the AWS Cloud WAN context fields, with values from a ping from VPC A (segment dev) to VPC C (segment prod). The src-eni, dst-eni, and subnet fields describe the network interfaces of the AWS Cloud WAN attachment, not of your instances. For descriptions of all 42 fields, refer to the AWS Cloud WAN Flow Logs documentation.
| Field | Description | Example |
| cwan-attachment-id | Attachment where the record was captured | attachment-0aaaaaaaaaaaaaaa1 |
| cwan-pair-attachment-id | Attachment at the other end of the flow, or – when there’s none, such as for a dropped packet | attachment-0ccccccccccccccc3 |
| srcaddr, dstaddr | Source and destination IP addresses | 10.1.0.5, 10.3.0.141 |
| flow-direction | ingress (entering the core network) or egress (leaving it) | ingress |
| src-region, dst-region | Where the traffic starts and ends | us-east-1, us-east-1 |
| src-segment-name, dst-segment-name | Source and destination segments | dev, prod |
| dst-attachment-type | One field with two uses: the destination attachment type, or the drop reason when AWS Cloud WAN drops the packet, such as drop:no-route | vpc |
packets-lost-* | Packets dropped in the core network for no route, blocked route, MTU exceeded, or TTL expired | 0 |
| network-function-group-attachment-ids | Network function group attachments that the flow passed through for service insertion, separated by commas, or – when the flow isn’t inspected | – |
| log-status | OK, NODATA (no traffic), SKIPDATA (records skipped), or INCOMPLETEDATA (incomplete flow: the flow couldn’t be fully captured during the interval) | OK |
Counting traffic accurately
AWS Cloud WAN records traffic each time it enters or leaves the core network through an attachment in scope. The following figure shows how a request and its response produce four records. To total traffic once, filter on flow-direction = 'ingress' or on one cwan-attachment-id.
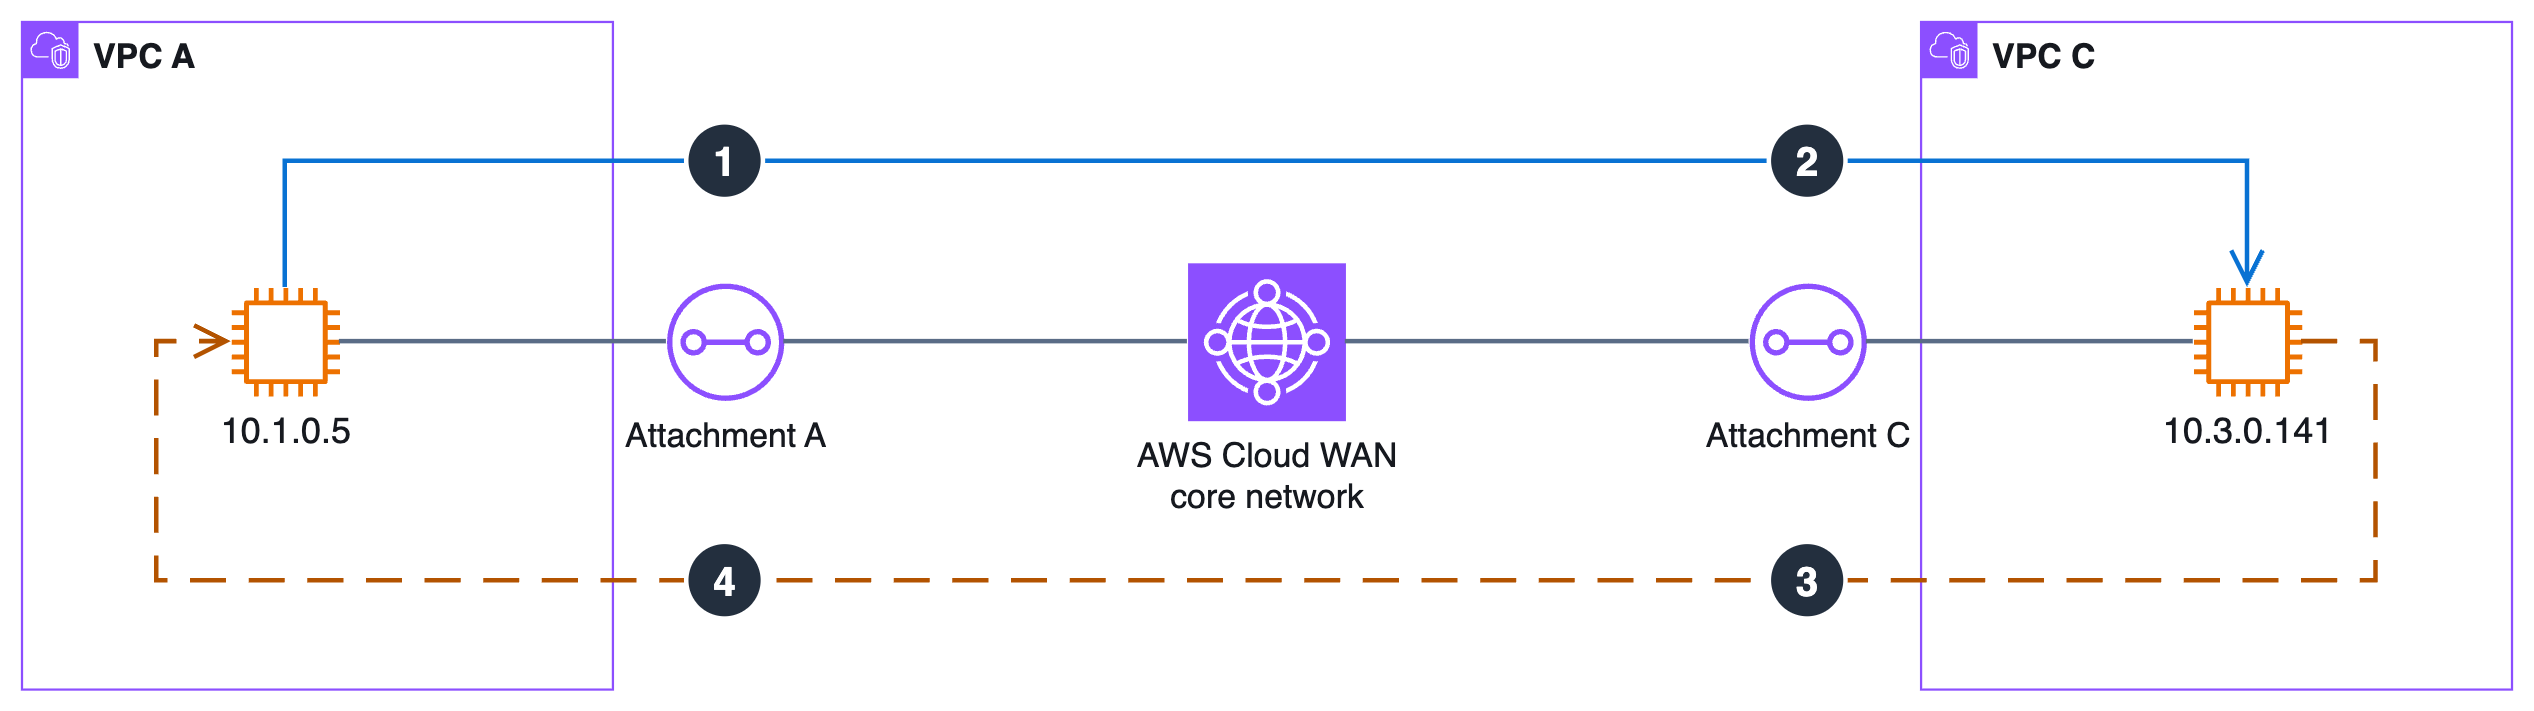
Figure 2: With both attachments in scope, a request and its response produce four records.
The solid line is the request, recorded at attachment A as ingress (1) and at attachment C as egress (2). The dashed line is the response, recorded at attachment C as ingress (3) and at attachment A as egress (4).
Walkthrough
The example core network has edges in us-east-1 and us-west-2, two segments that share routes, and three VPCs: A (us-east-1, dev), C (us-east-1, prod), and B (us-west-2, prod). The core network flow log goes to CloudWatch Logs and the others go to Amazon S3.
Prerequisites
You need the following:
- Access to the account that owns the core network. That account manages flow logs for all its attachments.
- AWS Identity and Access Management (IAM) permissions to create flow logs, including networkmanager:GetCoreNetwork on the core network. For delivery role examples, refer to the AWS Cloud WAN Flow Logs documentation.
- Attachments exchanging traffic. A flow log stays in
PROVISIONINGuntil AWS Cloud WAN delivers its first records. - AWS Command Line Interface (AWS CLI) version 2.40.1 or later.
Plan your first flow logs. Creating flow logs can briefly change the state of your core network or attachments:
- What locks the core network. The first core network flow log and the first edge flow log each set up delivery infrastructure, which briefly puts the core network in the
UPDATINGstate. Policy updates and other changes do the same. - What fails while it’s locked. While the core network is
UPDATING, attempts to create new attachments, core network flow logs, or edge flow logs fail. Check that it’sAVAILABLEbefore your next change. Attachment flow logs don’t change the core network state. The first flow log on an attachment briefly puts that attachment inUPDATING, and another flow log on that attachment fails until it’sAVAILABLEagain. - How long delivery takes. Your first flow log can take longer to deliver records, because AWS Cloud WAN provisions the delivery resources before it sends any. Later flow logs deliver records within about 10 minutes.
Step 1: Prepare your destinations
Amazon S3. Create a bucket in us-west-2 with S3 Block Public Access turned on. If your identity can update the bucket policy, AWS Cloud WAN adds statements that allow delivery.logs.amazonaws.com to write to each log prefix when you create the flow log. If you manage bucket policies as code, add these statements yourself. For the statement text, refer to Amazon S3 bucket permissions for flow logs. If the bucket uses an AWS Key Management Service (AWS KMS) key, the key policy must also allow that principal.
Amazon Data Firehose. Create a Direct PUT stream in us-west-2. When you create the flow log, AWS tags the stream with LogDeliveryEnabled=true and creates the AWSServiceRoleForLogDelivery service-linked role if it doesn’t exist yet. Records arrive as JSON lines, one per record, in the form {"message":"<record>"}.
Amazon CloudWatch Logs. Create a log group in us-west-2, the Region where you call the API, and an IAM role for delivery:
The trust policy (trust-policy.json) lets the flow logs service assume the role for your account:
The permissions policy (permissions-policy.json) lets the role write to your log group:
Step 2: Create flow logs
Each command sets its destination with the following options:
| Destination | --log-destination-type | Other options |
| Amazon CloudWatch Logs | cloud-watch-logs (default) | --log-group-name and --deliver-logs-permission-arn |
| Amazon S3 | s3 | --log-destination with the bucket ARN |
| Amazon Data Firehose | kinesis-data-firehose | --log-destination with the stream ARN |
Create a core network flow log in CloudWatch Logs
The following command sends the default format for every attachment:
The command returns the flow log ID:
Each attachment gets a log stream named <attachment-id>-all. If this is the first flow log on the core network, wait until the core network is AVAILABLE before you run the next command. The following command returns its state:
When the core network is ready, the command returns AVAILABLE.
Create an edge flow log in Amazon S3 as Parquet
The edge resource ID is the core network ID, a slash, and the edge’s Region code. The following command writes Apache Parquet with Hive-compatible, hourly partitions:
The command returns fl-0bbbbbbbbbbbbbbb2, and objects land under a path like the following:
The first edge flow log also puts the core network in UPDATING, so run the same check before you create the flow log for the second edge. To cover the second edge, run the same command with --resource-ids core-network-0123456789abcdef0/us-west-2, which returns fl-0ddddddddddddddd4.
Create an attachment flow log with a custom format
Pass --log-format with the AWS Cloud WAN fields you need, in single quotation marks so your shell doesn’t expand them:
The command returns fl-0ccccccccccccccc3. The following table shows the address and count fields from five records. Records 1 and 2 are an HTTP response and request, record 3 is a ping, and records 4 and 5 are drops.
| Record | srcaddr | dstaddr | srcport | dstport | protocol | bytes | packets |
| 1 | 10.3.0.141 | 10.1.0.5 | 8080 | 60274 | 6 | 20123662 | 2374 |
| 2 | 10.1.0.5 | 10.3.0.141 | 52882 | 8080 | 6 | 47831 | 919 |
| 3 | 10.1.0.5 | 10.3.0.141 | 24838 | 0 | 1 | 4872 | 58 |
| 4 | 10.1.0.5 | 10.99.0.10 | 33366 | 8080 | 6 | 120 | 2 |
| 5 | 10.1.0.5 | 10.98.0.10 | 57653 | 0 | 1 | 3276 | 39 |
The following table shows the AWS Cloud WAN context fields from the same records. For the drops in records 4 and 5, dst-region and dst-segment-name are a hyphen (-), because AWS Cloud WAN has no destination for the packet.
| Record | src-region | dst-region | src-segment-name | dst-segment-name | flow-direction |
| 1 | us-east-1 | us-east-1 | prod | dev | egress |
| 2 | us-east-1 | us-east-1 | dev | prod | ingress |
| 3 | us-east-1 | us-east-1 | dev | prod | ingress |
| 4 | us-east-1 | – | dev | – | ingress |
| 5 | us-east-1 | – | dev | – | ingress |
The default format doesn’t include the 1:1 NAT fields. To log them, add ${src-nat-addr} ${dst-nat-addr} to --log-format. A record sets at most one of them: src-nat-addr for traffic from the attachment that uses 1:1 NAT, and dst-nat-addr for traffic to it. srcaddr and dstaddr keep the VPC address, so to find traffic by its translated address, filter on the NAT fields.
Step 3: Check the status
Run the following command with the flow log ID from Step 2:
A flow log becomes ACTIVE when its first records arrive. After about 10 minutes, confirm that DeliverLogsStatus is still SUCCESS and that log streams or objects exist. If the status is FAILED, DeliverLogsErrorMessage gives the reason.
Analyzing AWS Cloud WAN Flow Logs
The following sections show how to find dropped traffic and query your flow logs.
Pinpoint routing issues
When AWS Cloud WAN drops a packet, the record shows why. The numbers match the following figure:
- 1, No route (10.99.0.10): the destination isn’t reachable from the source segment.
dst-attachment-typeisdrop:no-route, andpackets-lost-no-routecounts the packets. - 2, Blocked route (10.98.0.10): the destination matches a route that discards traffic.
dst-attachment-typeisdrop:blackhole, andpackets-lost-blackholecounts the packets. - 3, Time to live (TTL) expired (VPC C): the packet’s IP TTL, which the sender sets, runs out in the core network. In this example, the packet was sent with
ping -t 1.packets-lost-ttl-expiredcounts the packets on the destination attachment’s egress record.dst-attachment-typekeeps the real attachment type, such asvpc, so adrop:filter doesn’t find these.
For no-route and blocked-route drops, the destination attachment, VPC, Region, and segment fields are -, but dstaddr and dstport remain set.
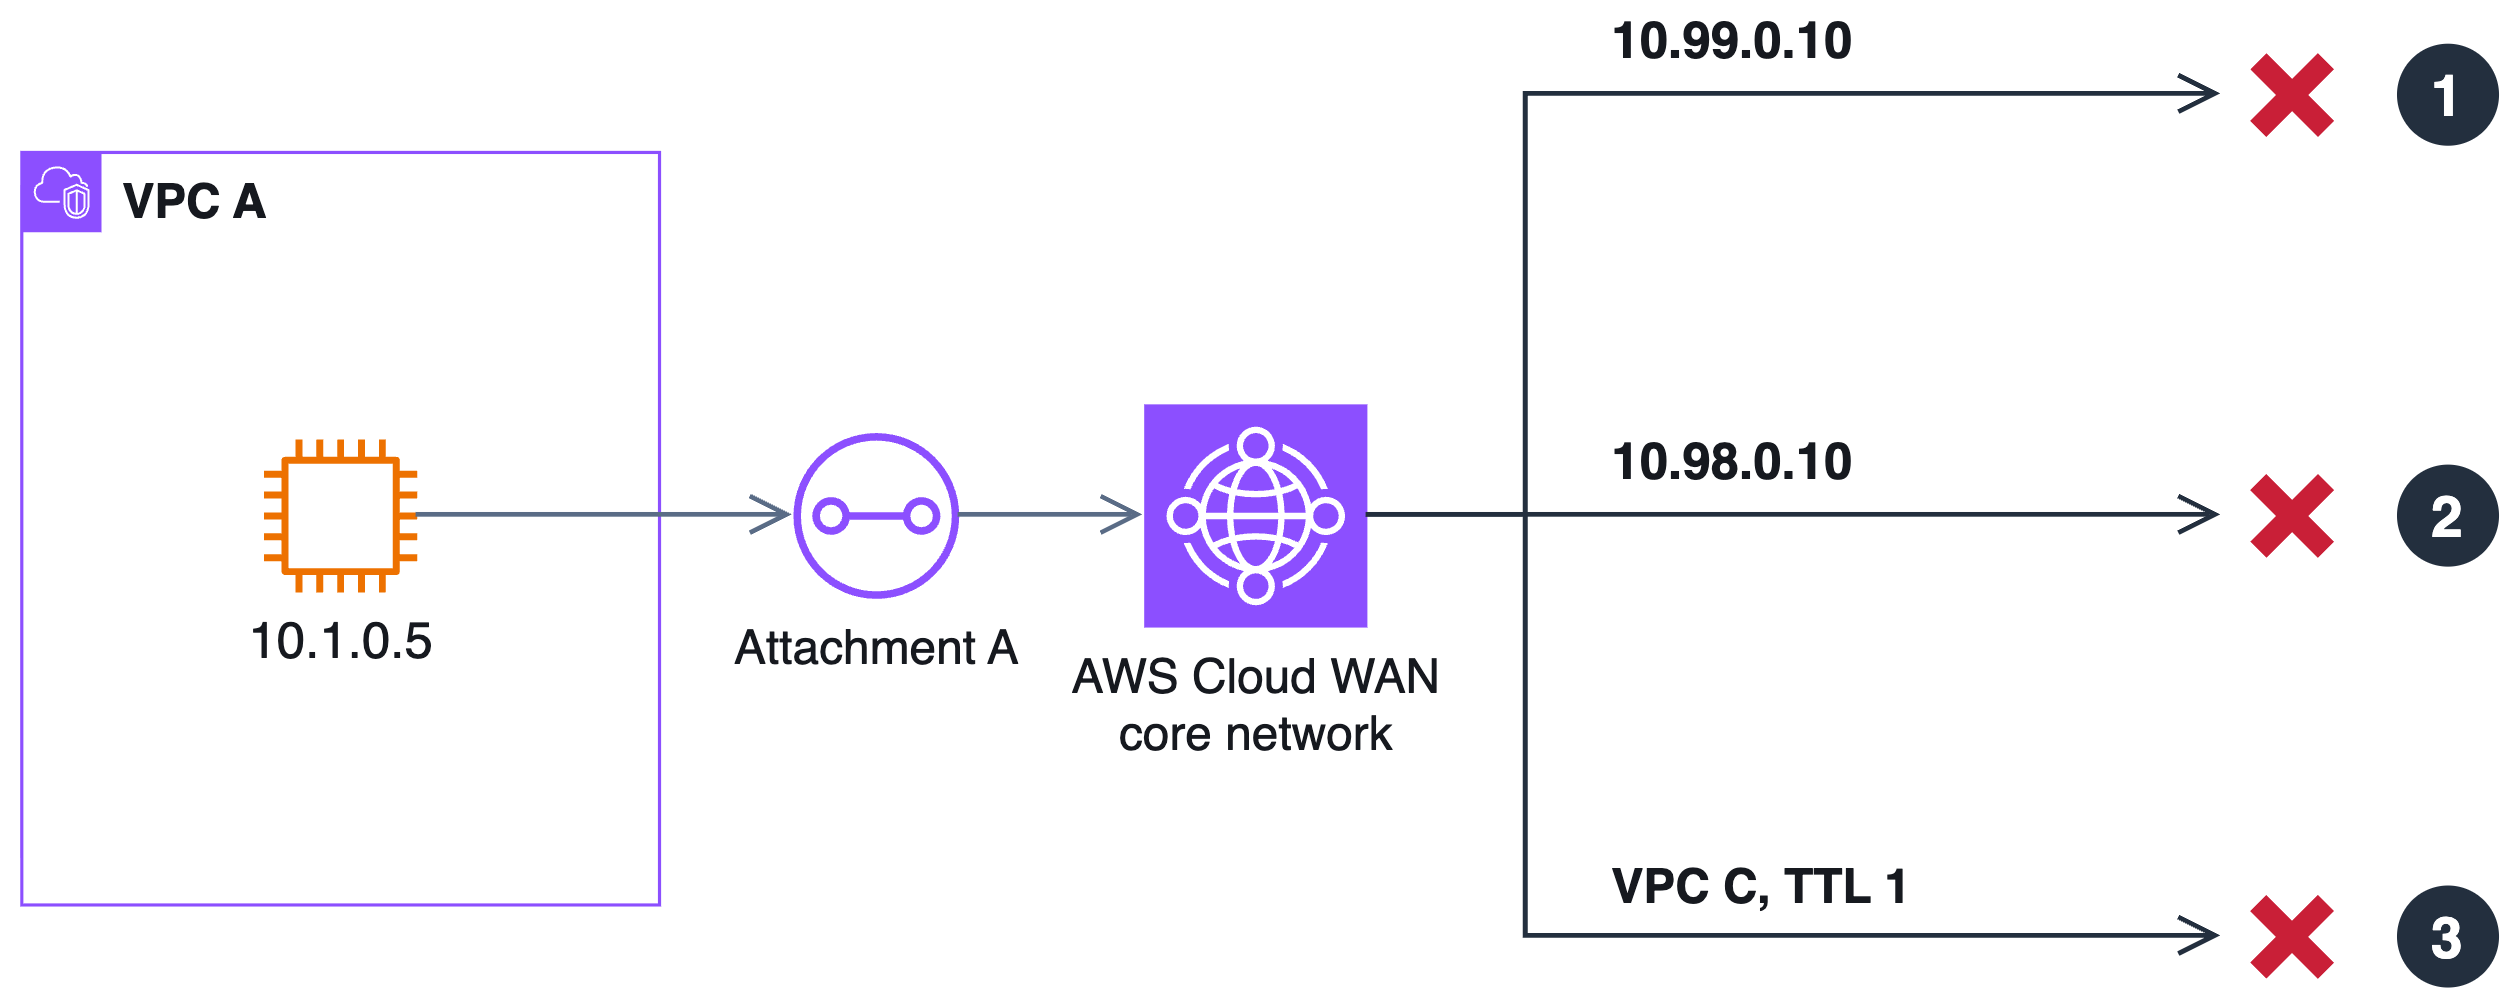
Figure 3: How flow logs record traffic that AWS Cloud WAN didn’t deliver.
Query with Amazon Athena
The following statement creates a table with partition projection over the Parquet flow logs, so new hourly partitions are queryable without an AWS Glue crawler.
The aws-region partition is the publishing Region, not the Region of your edge or bucket. Parquet column names use underscores, such as flow_direction. If your queries return no rows, check that projection.aws-region.values matches the aws-region= value in your own S3 object paths.
Traffic between segments
The following query totals ingress traffic for each segment pair:
The query returns the following:
Traffic between Regions
The following query shows inter-Region traffic for data transfer and workload planning. In this window, the – row is the dropped traffic.
The query returns the following:
Dropped traffic
The following query skips the ingress filter. AWS Cloud WAN records TTL-expired drops on the destination attachment as egress.
The query returns the following:
Because – also appears in NODATA and INCOMPLETEDATA records, filter on the drop: values to list only dropped destinations:
The query returns the following:
The following figure shows this query in the Athena query editor.
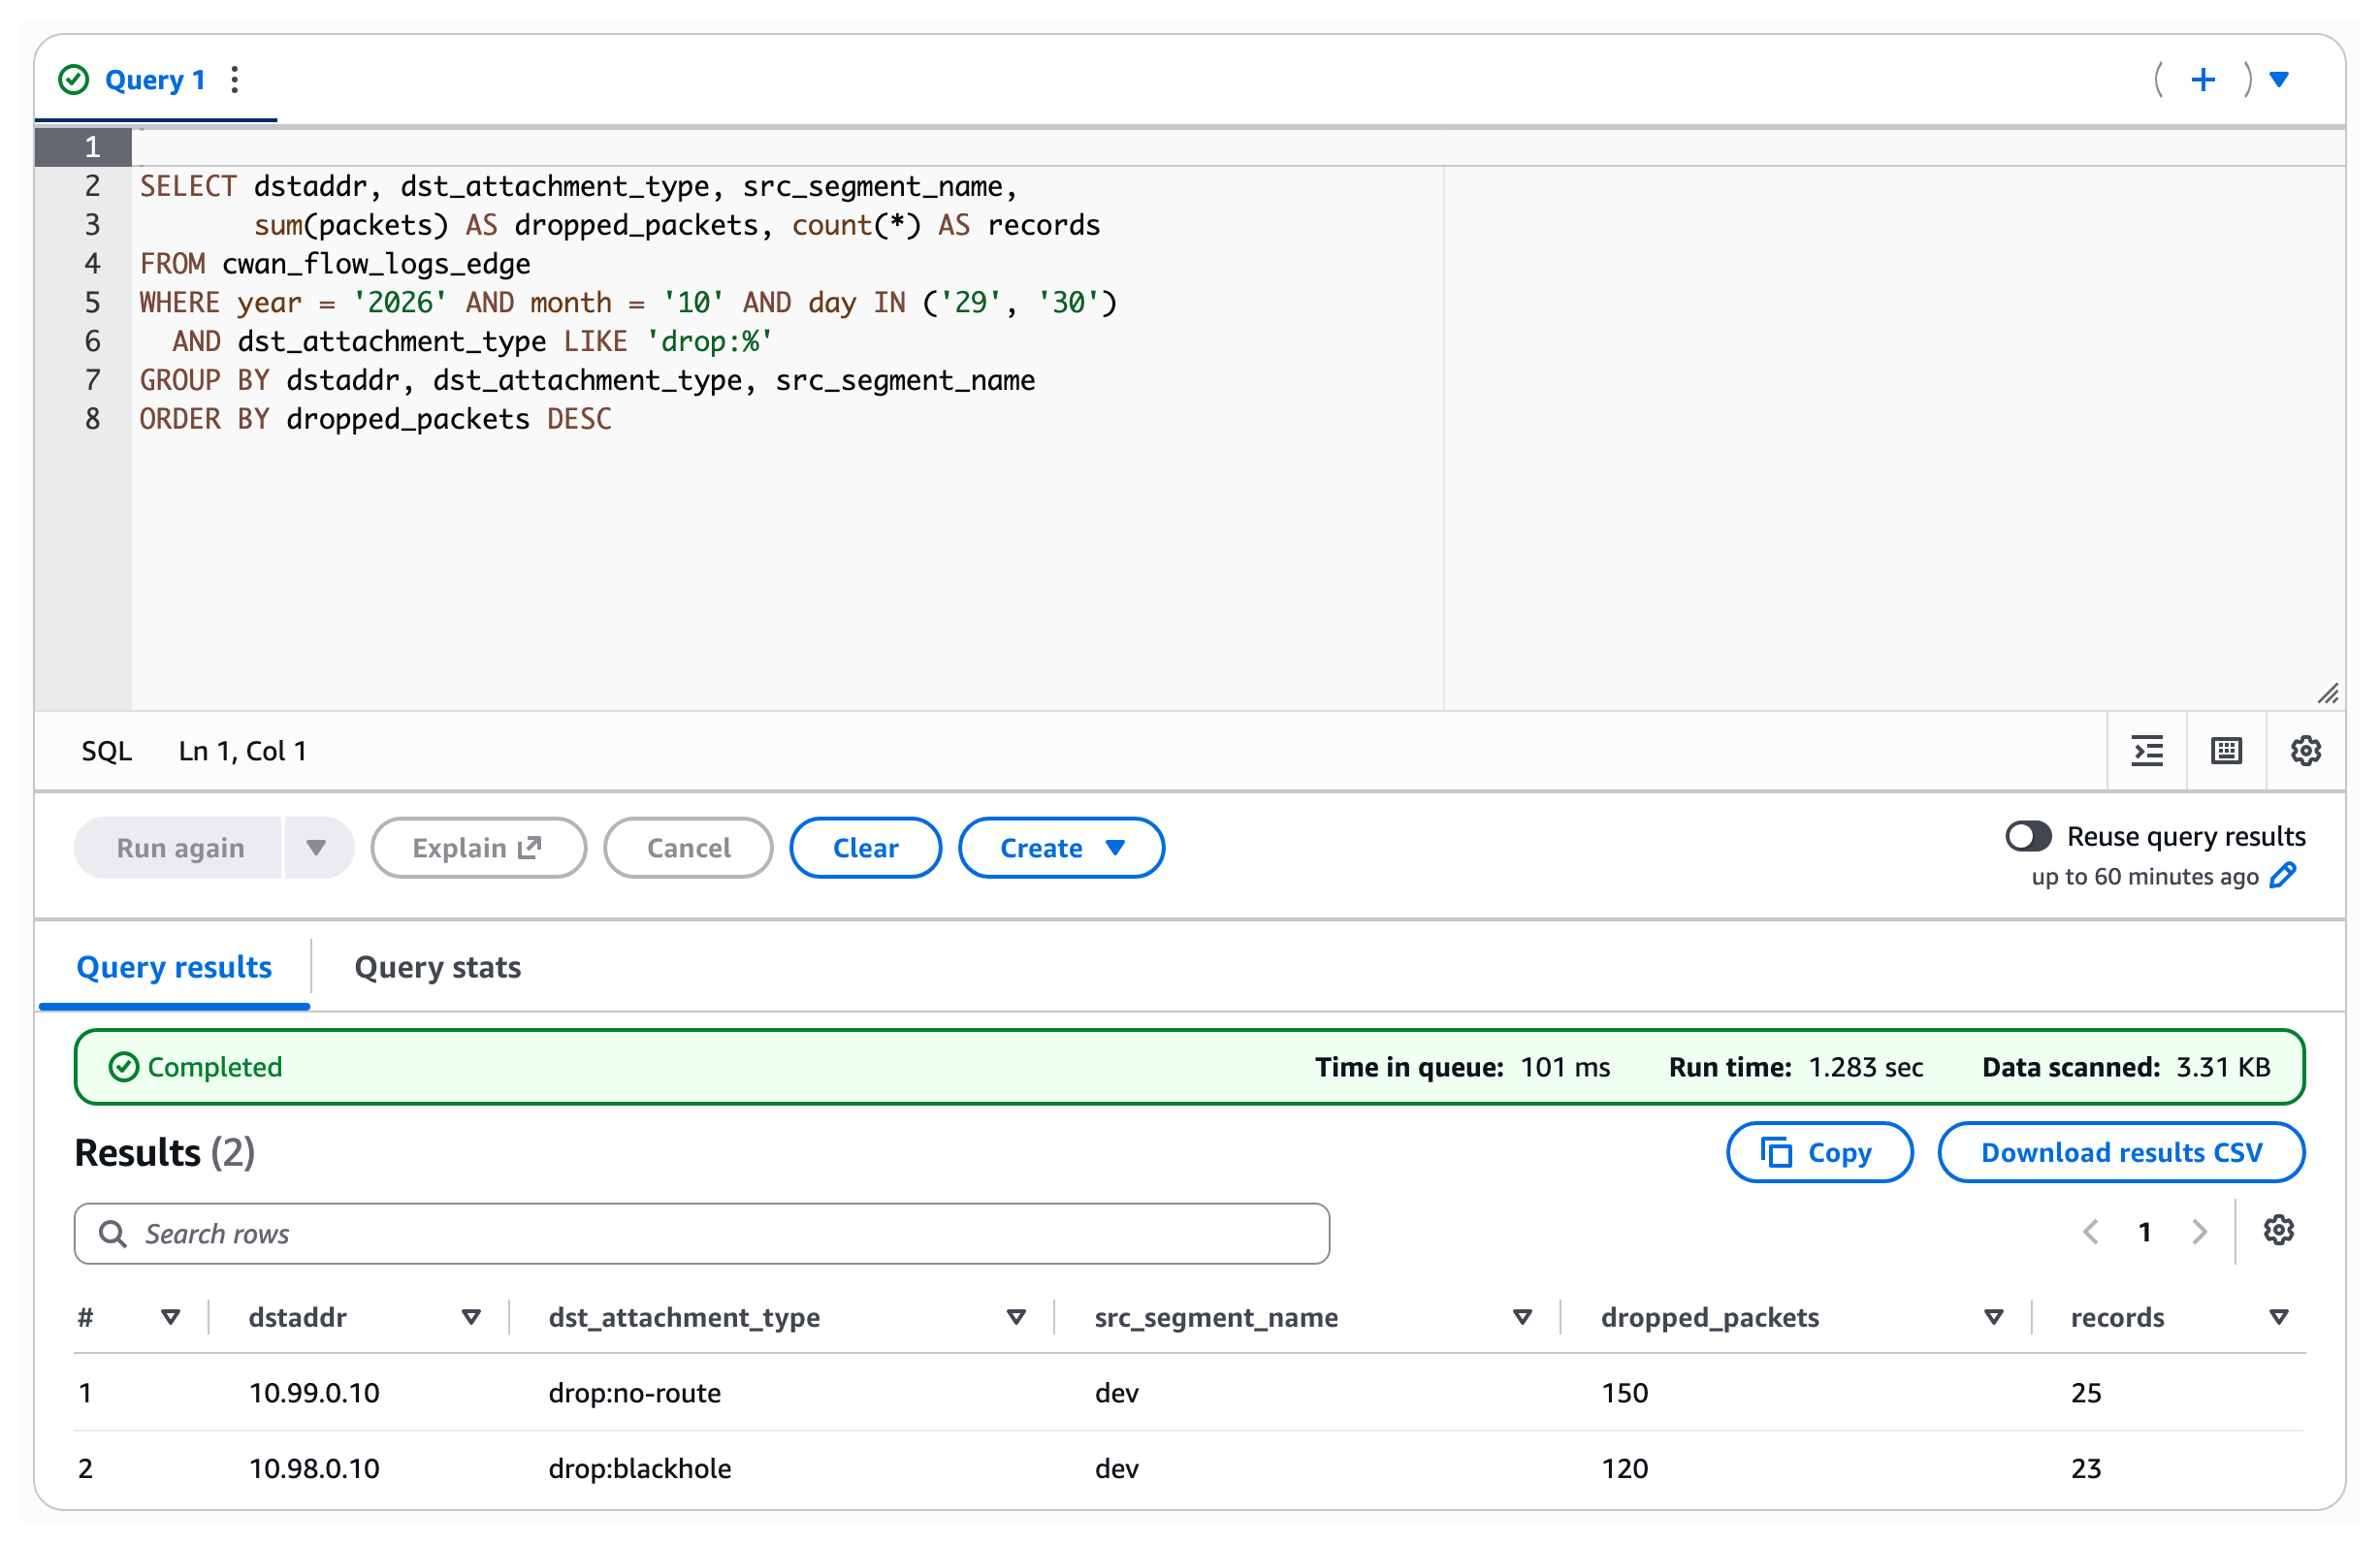
Figure 4: Destinations that AWS Cloud WAN dropped traffic to, by drop reason.
Traffic through service insertion
With a network function group and a send-via segment action, network_function_group_attachment_ids holds the inspection attachment IDs. For example, in a core network where a send-via action sends traffic between dev and prod through an inspection VPC, the following query lists the inspected flows:
The first four rows, with selected columns, show each inspected flow twice: ingress at the source attachment and egress at the destination attachment. Both records carry the inspection attachment. In the full output, cwan_pair_attachment_id names the other VPC attachment, not the inspection attachment.
AWS Cloud WAN logs inspected traffic at the source and destination attachments, not at the inspection attachment, so the ingress filter in the earlier queries still counts each inspected flow once. The field can hold more than one attachment ID, separated by commas. To match one of them, use contains(split(network_function_group_attachment_ids, ','), 'attachment-0e1e1e1e1e1e1e1e1').
Query with Amazon CloudWatch Logs Insights
For the core network flow log in CloudWatch Logs, the following query parses the default format, filters on ingress, and finds the top talkers:
The first row is a cross-Region flow from us-west-2:
The following figure shows the same query in the CloudWatch Logs Insights console. Because the query runs against the core network log group, it covers every attachment. The top two rows are the cross-Region flow between VPC B (us-west-2) and VPC C (us-east-1), one row per direction. The last two rows are the dropped traffic to 10.99.0.10 and 10.98.0.10.
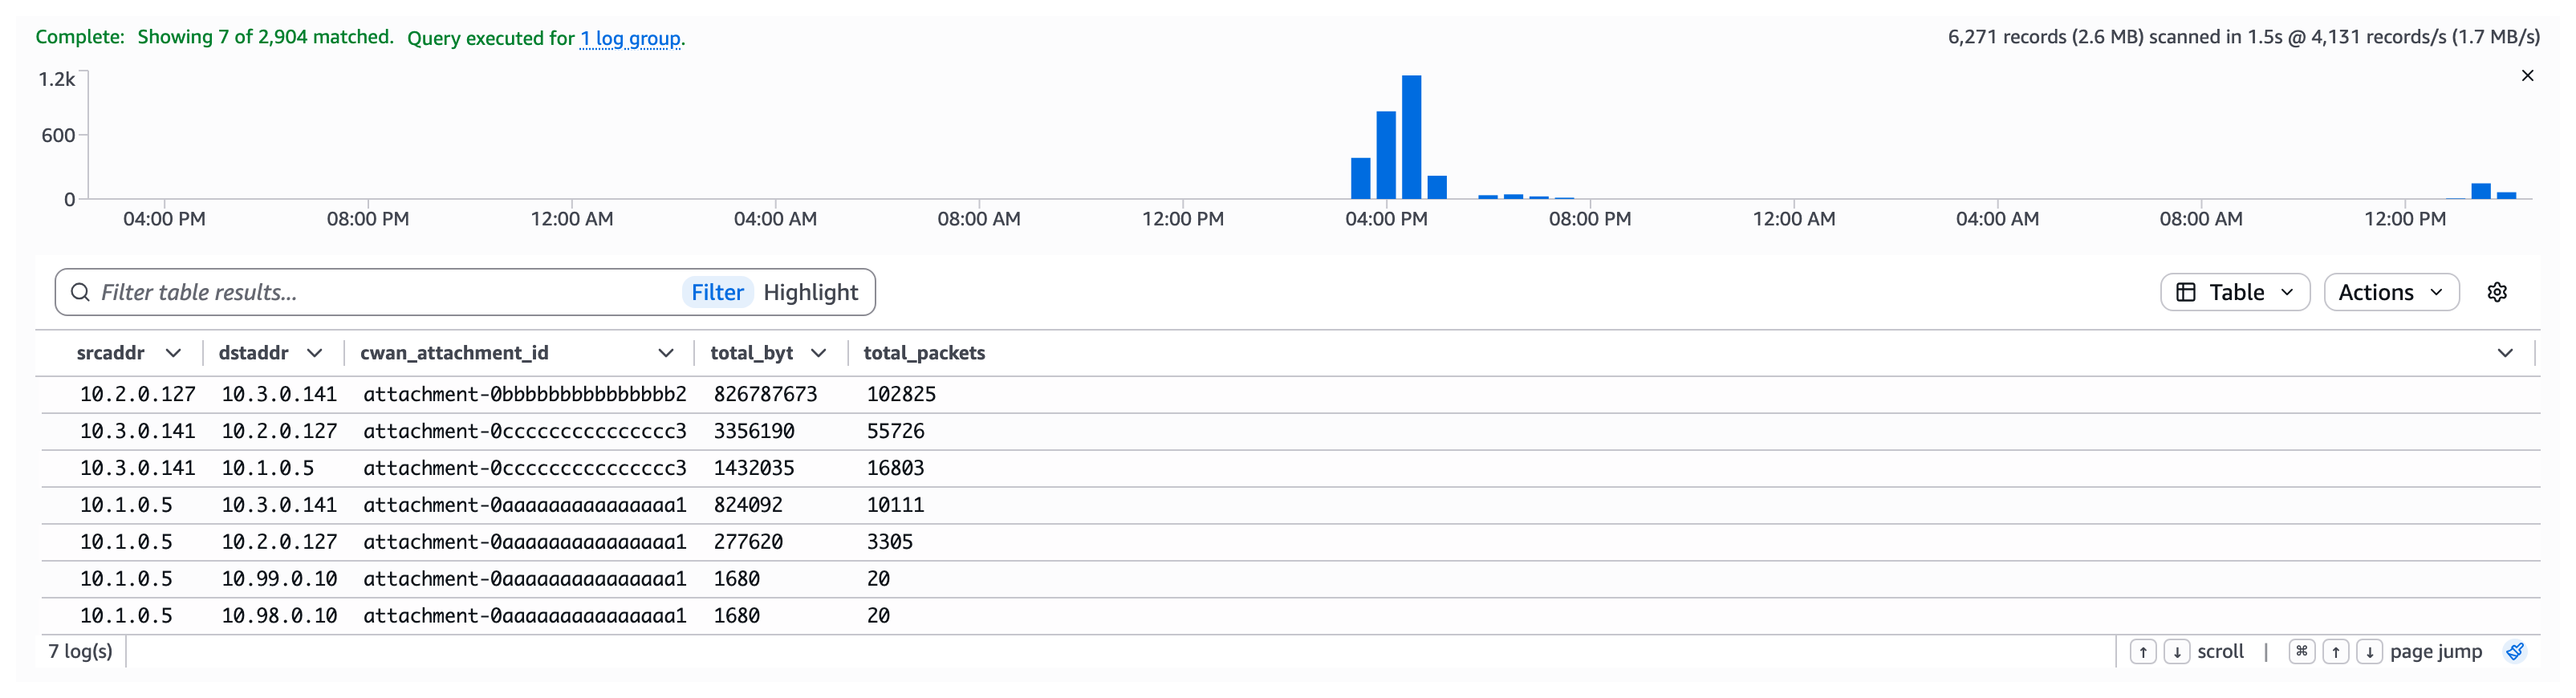
Figure 5: Top talkers by bytes in CloudWatch Logs Insights.
Things to know
Keep the following in mind:
- Flow logs are immutable. To change one, create a replacement, then delete the old one. AWS Cloud WAN rejects a flow log with the same resource, destination, and log format as an existing one with
FlowLogAlreadyExists. A different format for the same resource and destination is accepted. - Fixed options. The interval is 1 minute, and there’s no traffic-type filter. Custom formats take AWS Cloud WAN fields only, and Amazon S3 delivery supports plain text and Parquet.
- Cross-account data. Records for other accounts’ attachments, including their account and VPC IDs, go to the core network owner’s destination. Limit access when those accounts belong to another organization or to teams that shouldn’t see each other’s traffic. To do so, use S3 bucket policies, CloudWatch Logs resource policies, or IAM policies.
- Drops in an inspection VPC aren’t marked as drops. If traffic reaches the inspection attachment and doesn’t come back, the source attachment’s record shows the inspection attachment as cwan-pair-attachment-id. This happens, for example, when your firewall drops the traffic. The record has no
drop:value, thepackets-lost-*counters stay 0, and no record appears at the destination attachment. To find these drops, use your firewall’s own logs, such as AWS Network Firewall alert and flow logs. You can also use VPC Flow Logs on the inspection VPC’s appliance interfaces.
Cleanup
If you no longer need the resources from this walkthrough, delete the flow logs, then the destinations and the IAM role. If you reused an existing bucket, skip the delete-bucket command:
If you created the Athena table, drop it:
Conclusion
In this post, you created AWS Cloud WAN Flow Logs at three scopes and used the Region, segment, and drop fields to analyze cross-segment traffic, cross-Region traffic, and drops. You no longer need to turn on VPC Flow Logs in every VPC and correlate records across accounts. From the account that owns your core network, you get one view of your global network to find routing issues and plan for cross-Region traffic.
To get started and check Region availability, refer to the AWS Cloud WAN User Guide. If you have questions or feedback, leave a comment.
Further reading
To learn more, refer to the following resources:
- Logging IP traffic using VPC Flow Logs covers destinations and permissions.
- Querying Amazon VPC flow logs describes more table options.
- CloudWatch Logs Insights query syntax lists the query commands.
- Understand your network traffic trends using AWS Transit Gateway Flow Logs shows similar analysis for transit gateways.


