In our previous post, we built a custom agent for SQL Server deadlock and blocking investigation on Amazon Relational Database Service (Amazon RDS) for SQL Server using Strands Agents and Amazon Bedrock AgentCore runtime. That approach gives you full control, from model choice to deployment. With AWS DevOps Agent, you get the same result without building and running the agent yourself. It’s a managed service that triages alarms, groups related events, and sends findings to your team’s channels. Your database administrator (DBA) investigation process is written as a skill instead of a system prompt.
AWS DevOps Agent investigates operational events autonomously and delivers findings to your team. In this post, we walk through the architecture that exposes SQL Server diagnostic tools to AWS DevOps Agent as Model Context Protocol (MCP) tools. The tools run in an AWS Lambda function, and AgentCore Gateway, a capability of Amazon Bedrock AgentCore, hosts the MCP endpoint. We also show how an AWS DevOps Agent skill defines your DBA team’s investigation steps, severity thresholds, and report format. The sample’s AWS CloudFormation stack handles the setup. We then follow two investigations that combine built-in Amazon CloudWatch telemetry with direct SQL Server access through the Gateway.
Solution overview
This solution uses AWS DevOps Agent, Amazon Bedrock AgentCore Gateway, and AWS Lambda to automate database investigations for Amazon Relational Database Service (Amazon RDS) for SQL Server. The complete implementation is available on GitHub at sample-agentic-db-ops-sqlserver. The following diagram shows the architecture.
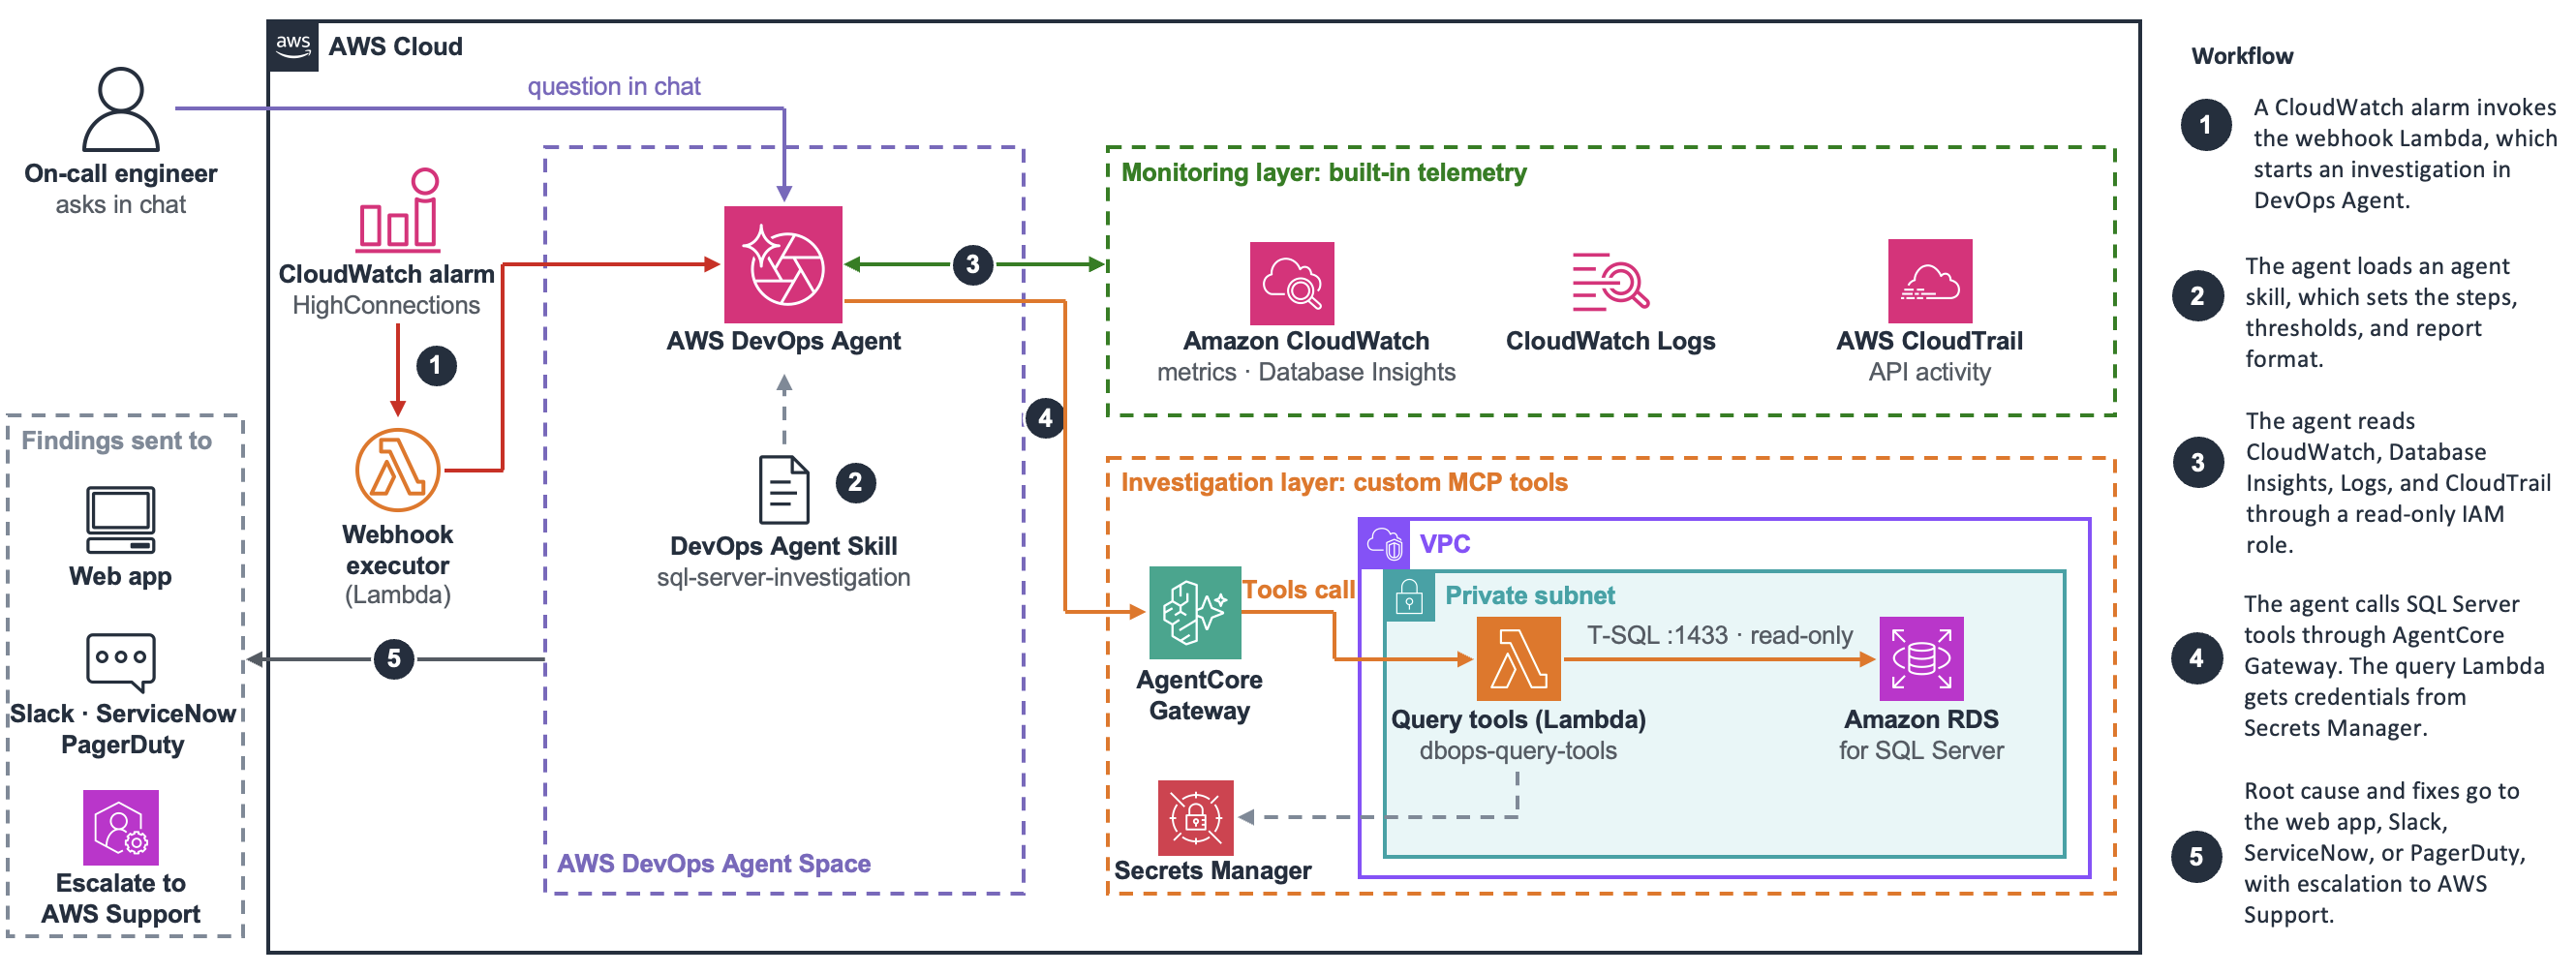
Figure 1: Solution architecture connecting AWS DevOps Agent to Amazon RDS for SQL Server diagnostics through Amazon Bedrock AgentCore Gateway
The solution has three main components.
AgentCore Gateway
AgentCore Gateway is a fully managed MCP endpoint that sits between AWS DevOps Agent and your database tools. You register your Lambda function as a target and define its tool schemas. The Gateway turns MCP tool calls into Lambda invocations, so you don’t run an MCP server. It also provides built-in observability and auditing. An MCP-compatible client connects to the Gateway URL over Streamable HTTP and, in this solution, authenticates with Signature Version 4 (SigV4). It can then discover and call your tools through standard tools/list and tools/call requests.
In this solution, the Gateway provides:
- SigV4 authentication for every caller.
- Optional fine-grained access policies. In this solution, AWS DevOps Agent can call only the tools on its allowlist.
- Database credentials stay away from the agent. The query tools Lambda function retrieves them from AWS Secrets Manager.
- Logs and metrics for each tool call, including the request, response, and duration. Logs require log delivery to be set up.
- The same endpoint can serve AWS DevOps Agent, your own agents, and other MCP clients.
AWS DevOps Agent
AWS DevOps Agent is a managed service that investigates incidents. You connect it to your AWS account and to the tools behind your Gateway. The agent receives alarms, decides what to check, calls the tools it needs, and sends findings to your team. It reads AWS data through a read-only AWS Identity and Access Management (IAM) role. It gets database detail only through the Gateway. The agent has no database connectivity and no access to database credentials.
AWS DevOps Agent also:
- Follows the investigation method in your skill when it picks tools.
- You can open an AWS Support case from an investigation, with the full context attached.
- Runs weekly evaluations and recommends improvements before incidents happen.
AWS DevOps Agent Skills
The AWS DevOps Agent Skills are self-contained instruction files that give the agent specialized domain knowledge and investigation methods built around your environment and how your team operates. Each skill is a directory of Markdown instructions. The sql-server-investigation skill in this post is organized as:
The SKILL.md is the only required file. It holds your DBA team’s investigation method in Markdown: when to use the skill, the step-by-step investigation procedure, the decision paths for different scenarios, and the expected outputs. It’s in plain Markdown format. The frontmatter names the skill and says when to use it, and the body holds the five-step method. The structure looks like this:
The skill covers five bottleneck types: CPU, blocking, I/O, memory, and network. This post’s investigation uses the blocking path (Step 3b), and the others follow the same pattern. For the complete skill, see SKILL.md.
The description acts as the trigger. When an incoming request matches the wording, the agent loads the skill and follows the five steps:
- Triage: Read health from Amazon CloudWatch and Amazon CloudWatch Database Insights and set severity against fixed thresholds.
- Diagnose: Find the dominant wait type over the incident window.
- Drill down: Investigate the dominant wait type. Each type runs the checks that fit it: top consumers and missing indexes for CPU, the blocking chain and head blocker for lock, IOPS and latency for I/O, memory-grant-heavy queries for memory, and throughput for network.
- Correlate: Check whether the problem is a recent regression or chronic, and compare against the baseline.
- Recommend: Report severity, root cause, evidence, and fixes in priority order.
Every step reads built-in AWS telemetry first and uses the query tools only for the session-, plan-, and index-level detail telemetry doesn’t expose.
SKILL.md is the skill itself. To adapt it to your environment, edit this file directly. Add a wait type, point a step at a different tool, or change a severity threshold. The agent picks up the change on its next investigation.
For guidance on writing skills, see Best practices for writing AWS DevOps Agent Skills.
The references/tool-reference.md file contains the skill’s lookup tables: the health-metric thresholds (normal, warning, critical for each metric), each query tool’s parameters and defaults, and the wait-event catalog that maps each SQL Server wait to a bottleneck type.
How an investigation flows
This section walks through an investigation in five steps, from the alarm to the findings.
1. The investigation begins with a trigger. An Amazon CloudWatch alarm on your RDS instance invokes a webhook executor Lambda, which posts the event to the AWS DevOps Agent webhook. You can also start an investigation from the AWS DevOps Agent web app or from a ticketing integration such as ServiceNow. For the full list of trigger options, refer to Autonomous incident response.
Before starting a full investigation, AWS DevOps Agent runs incident triage. It compares the new event with active investigations from a recent look-back window. It checks for similar components, the same AWS Region, and timing. If the event belongs to an existing investigation, the agent links the two. If it matches skip criteria in a skill, the agent skips it. Otherwise, it starts a new investigation.
2. Next, the agent loads the sql-server-investigation skill, which sets the steps, severity thresholds, and report format.
3. The agent then reads built-in telemetry. Through its IAM role, it checks Amazon CloudWatch metrics, Database Insights, Amazon CloudWatch Logs, and AWS CloudTrail to see which metric is high and which wait type dominates. It also checks whether any recent API activity lines up with the spike.
4. For blocking chains, bad execution plans, or missing indexes, the agent calls your custom MCP tools through AgentCore Gateway, which authenticates the call with SigV4. AWS DevOps Agent can call only the tools on its allowlist. Behind the Gateway, the query tools Lambda function retrieves the database credentials from Secrets Manager, so the agent never sees a database password.
The query tools Lambda function (dbops-query-tools) runs in a private subnet of your virtual private cloud (VPC) and connects to the RDS instance. It returns session- and plan-level detail that goes deeper than CloudWatch metrics. This includes the head blocker’s session ID, the exact SQL text, and the execution plan hash.
5. When it’s done, the agent sends its findings (severity, root cause, and recommended fixes) to the AWS DevOps Agent web app, Slack, ServiceNow, or PagerDuty. You can also escalate to AWS Support.
Built-in telemetry and the MCP tools do different jobs. Built-in telemetry is the monitoring layer: it shows what kind of problem you have. The MCP tools are the investigation layer: they show which session, which plan, and why, using blocking chains, slow queries, Query Store history, execution plans, and missing index recommendations.
Getting started
To deploy this solution, follow the README.md in the sample repository. A single CloudFormation stack, dbops-devops-agent.yaml, creates the solution’s resources. The important resources are:
- Two Lambda functions:
dbops-query-tools, which hosts the custom MCP tools, anddbops-webhook-executor, which receives an Amazon CloudWatch alarm and sends an HMAC-signed request to the AWS DevOps Agent webhook. - AgentCore Gateway: SigV4 inbound auth and a target that registers the 13 tool schemas from the
dbops-query-toolsLambda function. - Agent Space: The operator web app, your AWS account associated for read access, and the gateway registered as an MCP service.
- Webhook secret and three Amazon CloudWatch alarms (
dbops-demo-HighCPU,dbops-demo-HighConnections,dbops-demo-HighReadLatency).
AWS DevOps Agent calls the 13 tools in dbops-query-tools for SQL Server detail it can’t read from CloudWatch or CloudWatch Database Insights:
| Tool | What it does |
check_query_store_enabled | Checks whether Query Store is enabled on the database |
get_query_store_top_queries | Lists the top queries by CPU, duration, I/O, or memory |
get_query_store_regressed_queries | Finds queries whose performance has regressed |
get_query_store_wait_stats | Shows wait statistics recorded by Query Store |
get_query_execution_history | Shows the execution history for one query |
get_query_store_plan_summary | Summarizes the execution plans for one query |
get_slow_queries | Lists queries running slowly right now |
get_blocking_sessions | Shows the current blocking chains |
get_query_plan_from_cache | Gets the cached execution plan for a query |
get_expensive_queries_from_cache | Lists the most expensive cached queries |
suggest_indexes | Returns SQL Server’s missing-index suggestions |
get_index_usage | Shows how often each index is used |
send_email_notification | Sends an alert email through Amazon Simple Notification Service (Amazon SNS) |
After it deploys, you upload the investigation skill and create the webhook credentials on the console.
Before you begin, confirm these prerequisites:
- An Amazon RDS for SQL Server instance with Amazon CloudWatch Database Insights enabled.
- Database credentials stored in Secrets Manager with a login that has
VIEW SERVER STATEandVIEW DATABASE STATEpermissions. - A VPC with private subnets and a security group allowing access to RDS on port 1433.
- Access to Amazon Bedrock and AWS DevOps Agent in a supported region.
- Python 3.12+ for local deployment scripts and the Lambda runtime.
Simulating the incident
The test scenario creates a blocking incident on the RDS instance. A script on the bastion host opens a transaction and updates a row in dbo.Orders. It holds the lock for 5 minutes with a WAITFOR DELAY. It then starts 14 sessions that try to update the same row and block behind the head blocker, forming a 15-deep blocking chain. It also opens 5 padding connections. That adds 20 connections. On top of the instance’s baseline of roughly 8, the total reaches 28, above the HighConnections alarm threshold of 10. For the script, refer to run_blocking_demo.ps1.
In use case 1, an engineer asks about the incident in chat. In use case 2, the alarm starts an investigation on its own.
Use case 1: Answer an on-call question from the chat
An on-call engineer gets paged: the production database has a connection-count alert, and users say the app is slow. Instead of opening Database Insights and a SQL client side by side, they open the AWS DevOps Agent chat panel and ask:
“Is the production SQL Server instance healthy right now? Any alarms in the last hour?”
Chat is available as a persistent panel on the left side of the AWS DevOps Agent Space web app. Choose + New chat to start a conversation. For more information about accessing chats, refer to On Demand DevOps Tasks.
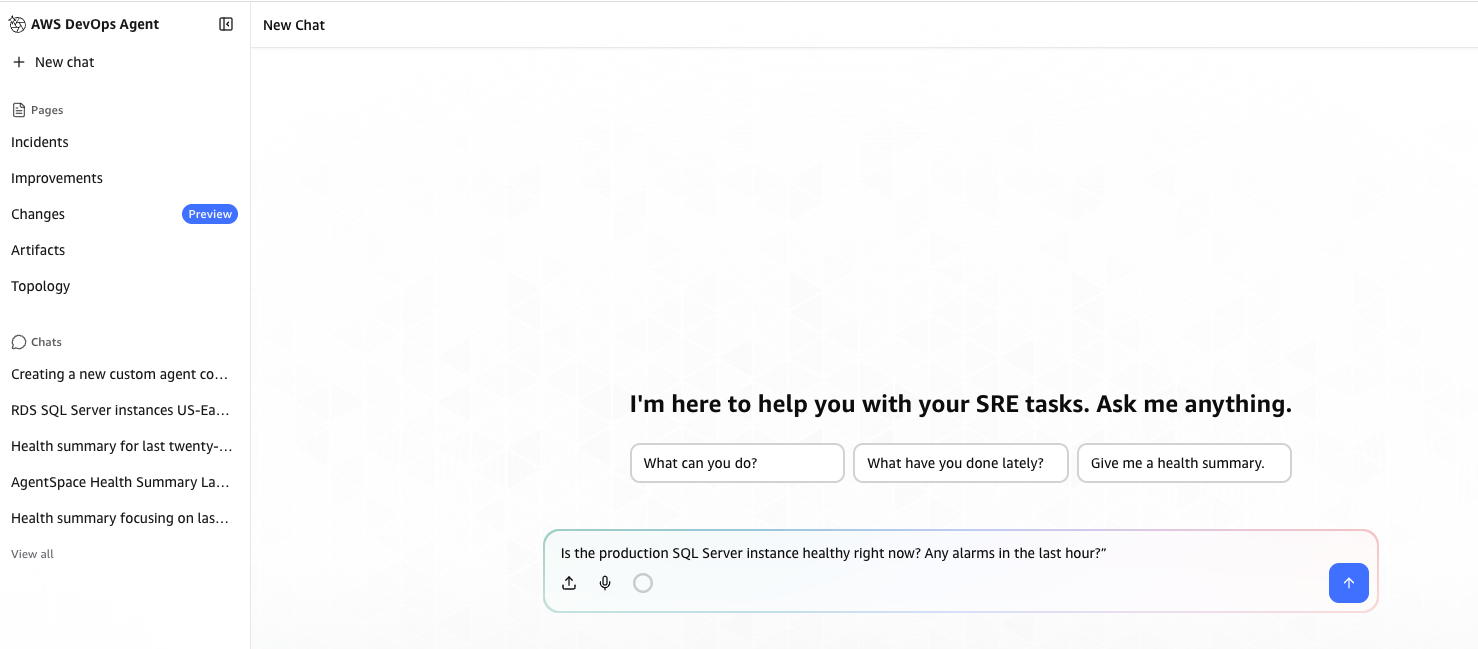
Figure 2: AWS DevOps Agent chat panel showing the operator’s question
The agent answers with a health summary: the active alarm, the current metrics, and a connection pattern worth a look.
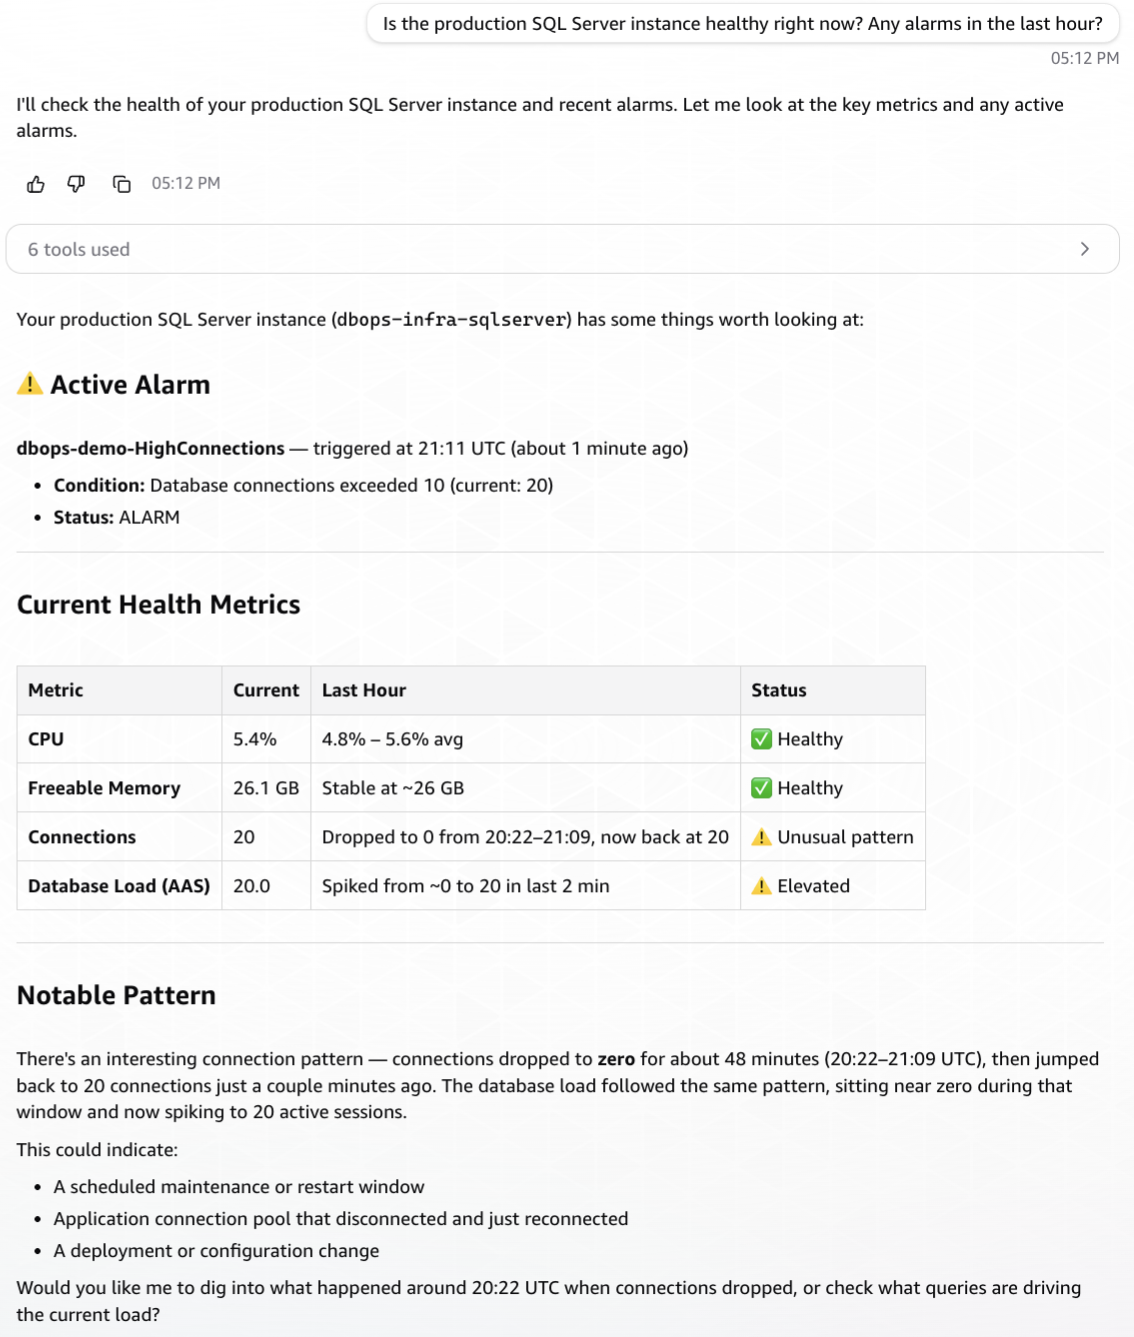
Figure 3: The agent’s health check showing the active HighConnections alarm, a health-metrics table, and the unusual connection pattern it flagged for investigation
The agent answers from live telemetry. CPU usage is about 5.4% and freeable memory is steady at 26 GB, so the instance itself is healthy.
One problem stands out. The dbops-demo-HighConnections alarm triggered at 21:11 UTC, with connections at 20 against a threshold of 10. Database load, measured as Average Active Sessions (AAS), had spiked from about 0 to 20 in the last two minutes. The agent also notices that connections dropped to zero for roughly 47 minutes, then jumped back to 20, and offers to investigate. In one answer, the engineer learns the instance is healthy overall but has a connection spike worth checking.
In the next use case, nobody asks a question. The alarm starts the investigation, and the findings go straight to your team.
Use case 2: Investigate a blocking incident triggered by alarm
Within two minutes of the incident starting, the dbops-demo-HighConnections alarm goes into ALARM state and invokes the webhook executor Lambda, which posts the event to AWS DevOps Agent. You can find the investigation on the Incidents page of the AWS DevOps Agent Space web app. For more information, see Autonomous incident response. The investigation starts on its own, and “Triggered by Event Channel” appears at the top of the timeline.
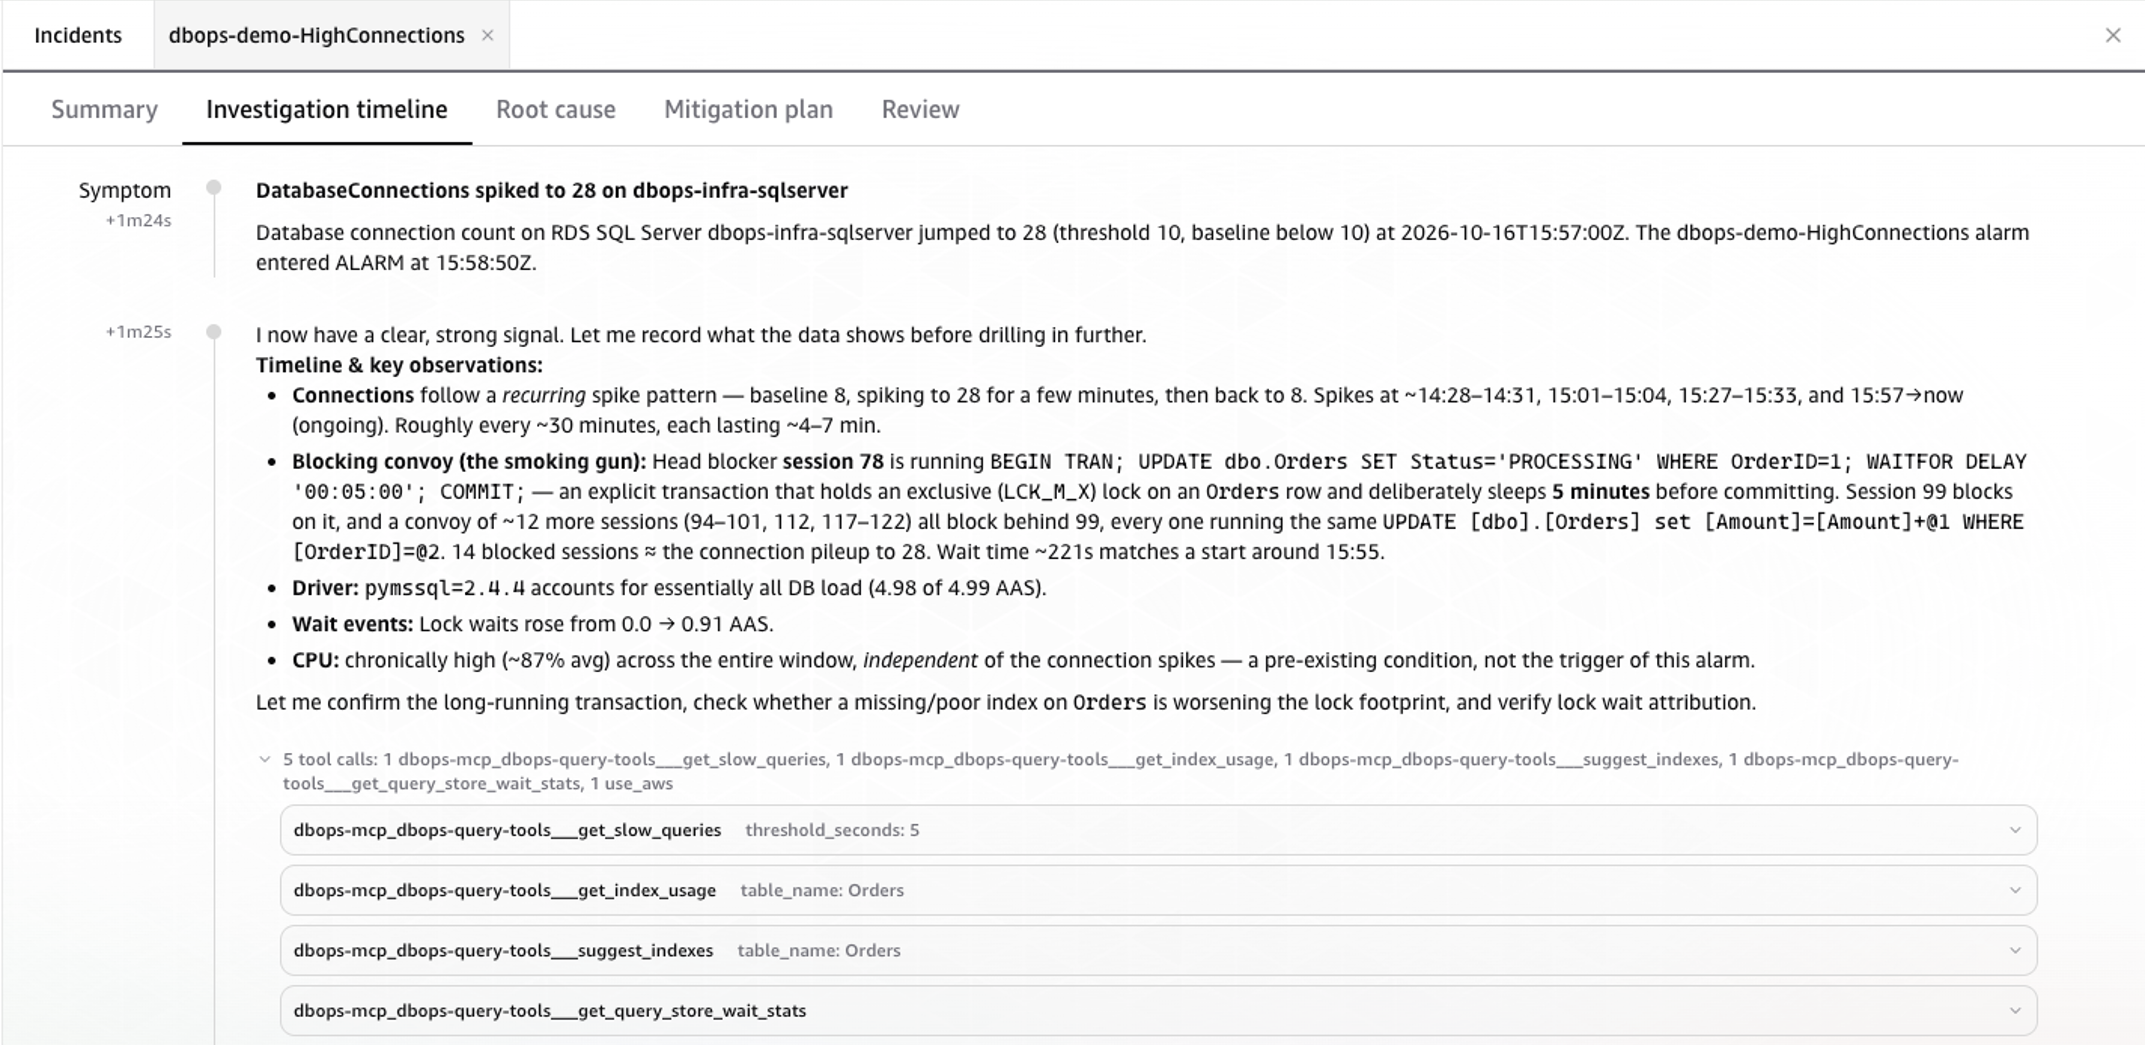
Figure 4: Investigation timeline showing the recurring DatabaseConnections spike from 8 to 28, average active sessions of 4.99, CPU chronically high at about 87%, lock waits rising from 0.0 to 0.91 AAS, and the agent calling the MCP tools through the Gateway, including get_slow_queries, get_index_usage, suggest_indexes, and get_query_store_wait_stats
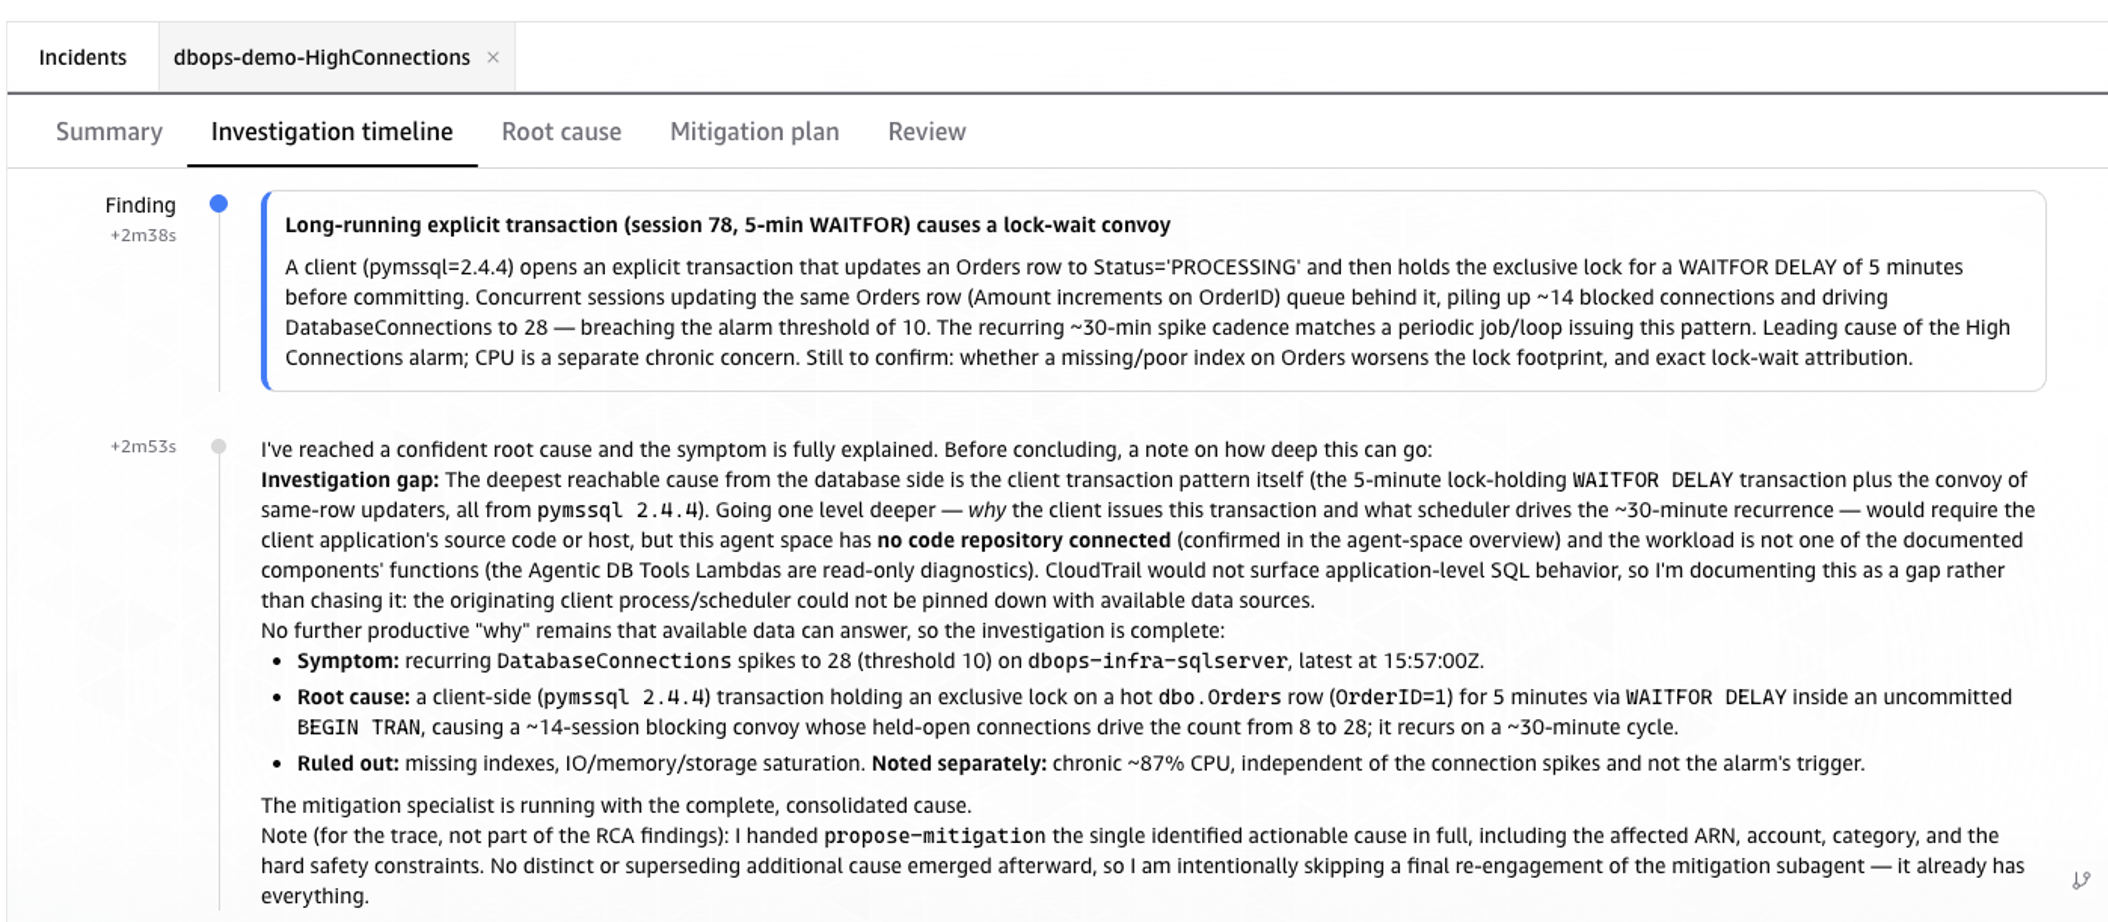
Figure 5: Investigation finding showing head blocker session 78, the roughly 14-session blocking convoy with waiters numbered in the 94 to 122 range, and detection of the recurring 30-minute pattern
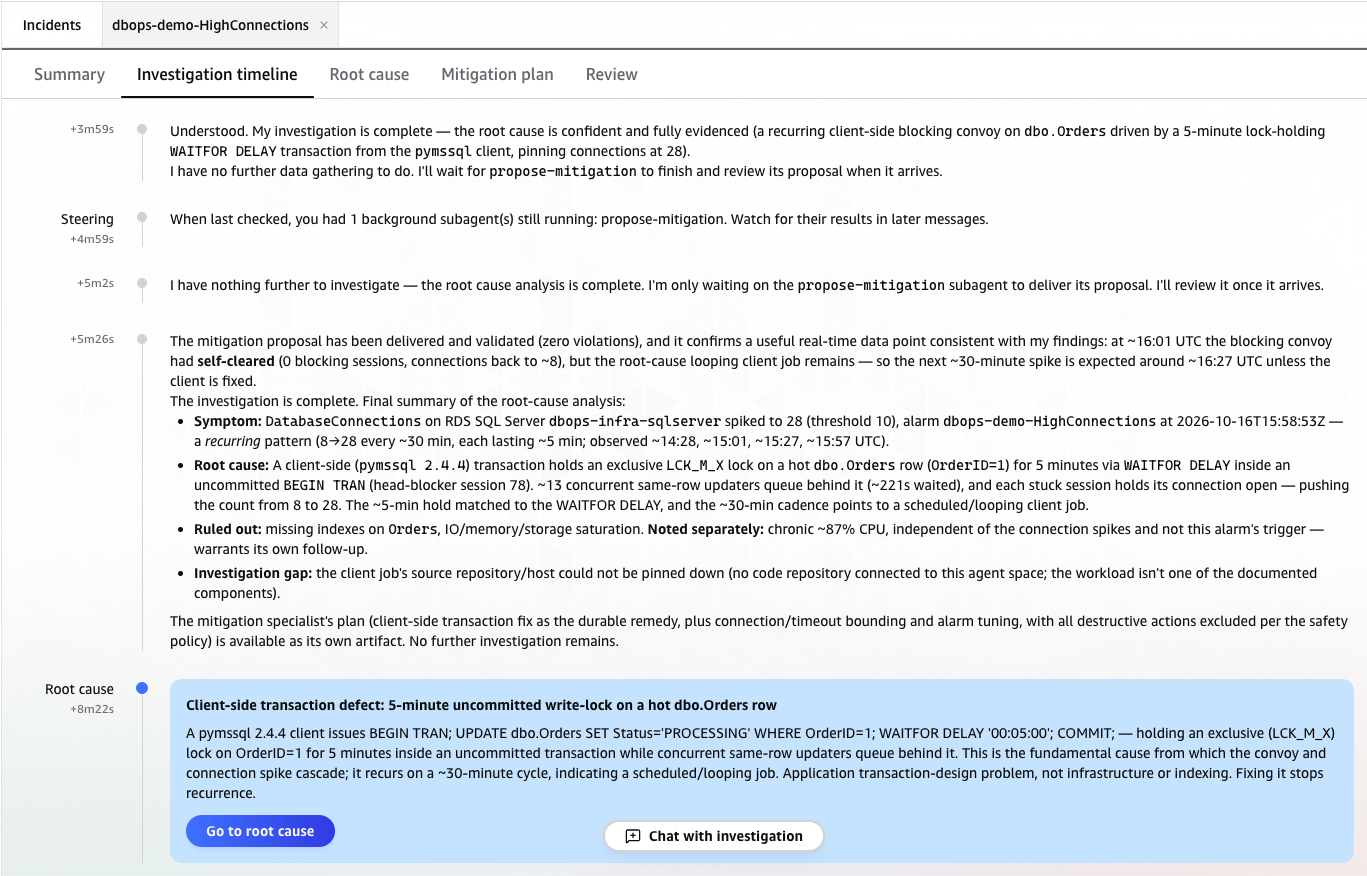
Figure 6: Root cause identification showing a client-side pymssql 2.4.4 transaction holding a 5-minute uncommitted write lock on a hot dbo.Orders row, with the originating client host noted as an investigation gap
Figures 4–6 show each step in the investigation timeline, and Figure 7 summarizes what the agent found.
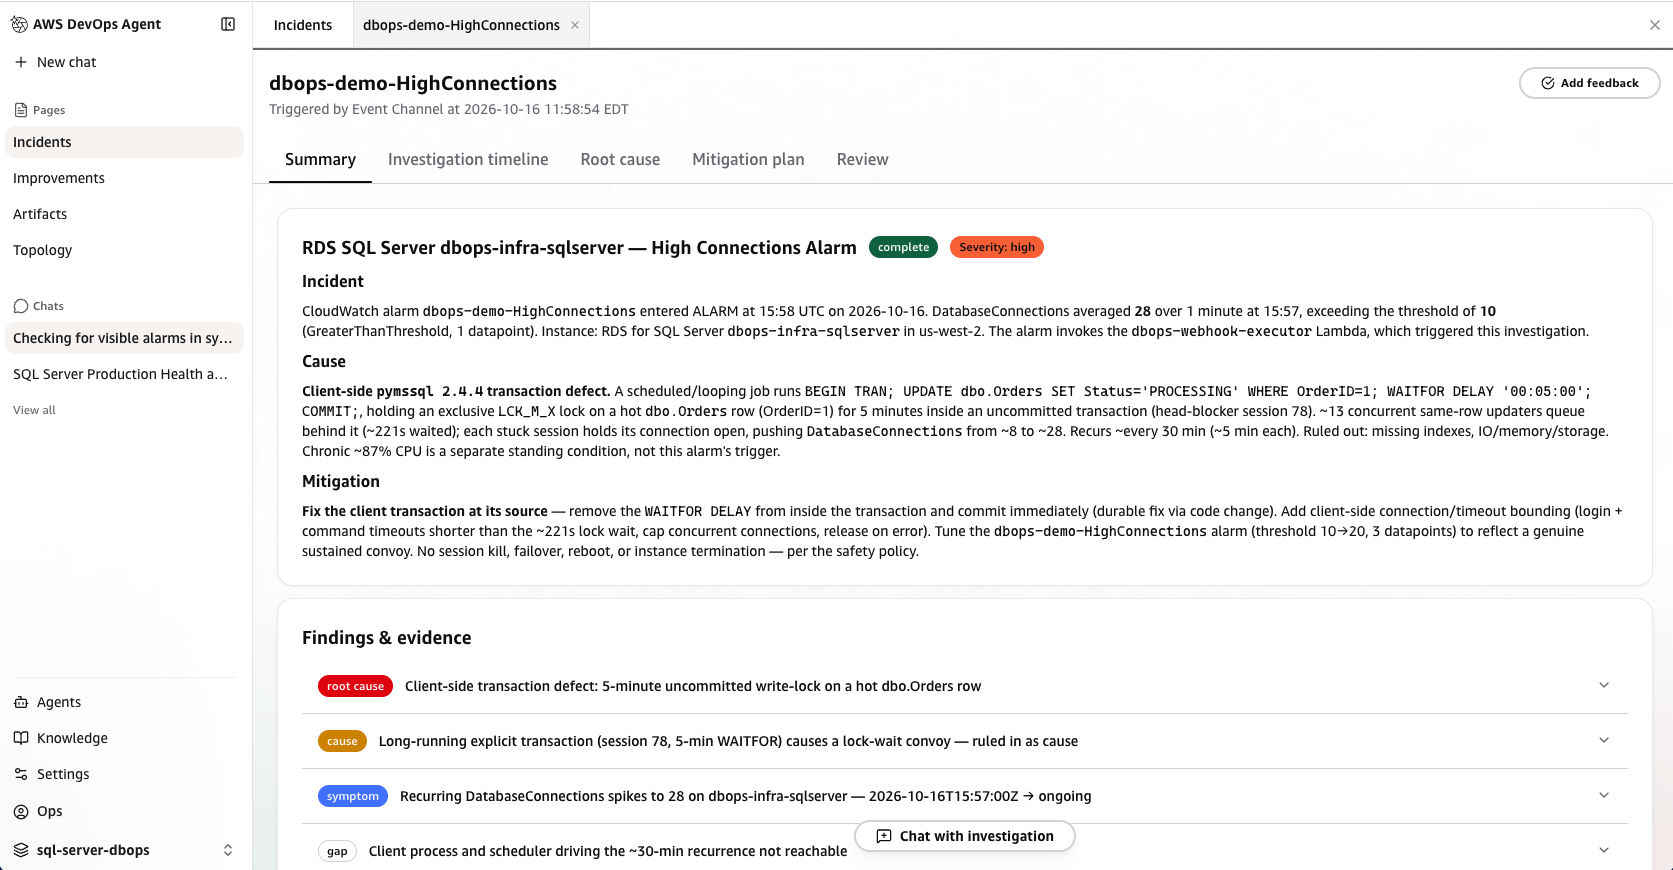
Figure 7: The investigation summary showing the incident, cause, mitigation, and the findings and evidence the agent collected
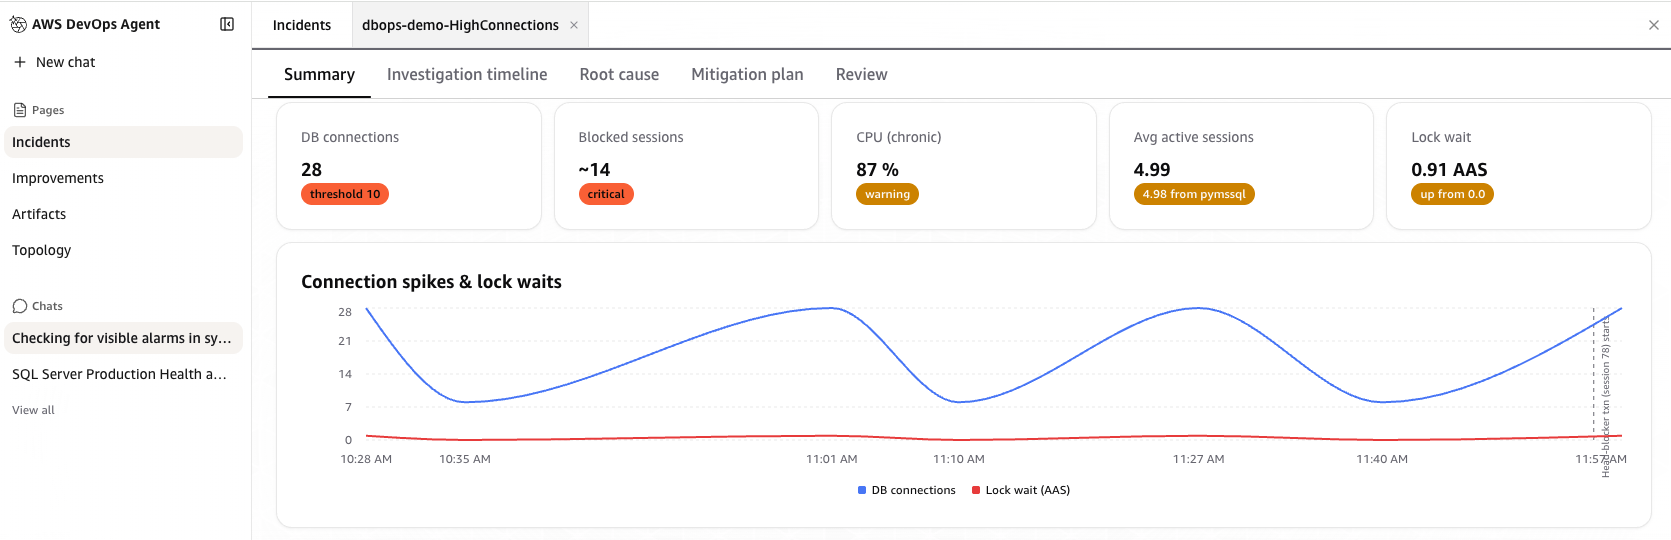
Figure 8: Connection spikes and lock wait over time, with DatabaseConnections oscillating between roughly 8 and 28 on a 30-minute cycle while lock wait (AAS) stays low
The chart in Figure 8 shows time in US Eastern (local) time, whereas the rest of this post uses UTC. The final spike at 11:57 AM Eastern is the same event the timeline records at 15:57 UTC.
The agent worked through the skill’s five steps:
- Triage: Database load averaged 4.99 AAS and the
dbops-demo-HighConnectionsalarm was in ALARM with connections at 28 against a threshold of 10. CPU was chronically high at about 87 percent, but as a separate standing condition rather than this alarm’s trigger. Severity: HIGH. - Diagnose: Lock was the dominant wait type (0.91 AAS, up from 0.0), so the skill sent the agent to check for blocking.
- Drill down: The agent queried SQL Server through the Gateway and found head blocker session 78 holding an exclusive lock on one row of
dbo.Orders(OrderID=1), with about 14 sessions waiting behind it. - Correlate: The spike was part of a recurring pattern. About every 30 minutes, connections rose from 8 to 28, and each spike lasted about 4–7 minutes. This matches a transaction that holds a lock for 5 minutes with
WAITFOR DELAY. AWS CloudTrail showed no RDS configuration changes in that period.
The agent couldn’t reach the client process or the scheduler that started the transaction. The Agent Space had no connected code repository, and the workload wasn’t one of the documented components. The agent reported this as an investigation gap instead of guessing the source.
- Recommend: The agent identified a client-side transaction defect as the root cause: a
pymssql2.4.4 client runningBEGIN TRAN; UPDATE dbo.Orders ... WAITFOR DELAY '00:05:00'; COMMIT. It recommended removing theWAITFOR DELAYso the transaction commits immediately, bounding client connection and command timeouts, and raising the alarm threshold from 10 to 20. It recommended no session termination, failover, or reboot, per the safety policy.
The agent went from a generic connection alarm to the blocking session and the SQL behind it, without any human involved.
Security considerations
The solution limits database access at three layers:
- AWS DevOps Agent IAM role: Read-only AWS API access and no Secrets Manager permissions. The agent can reach SQL Server only through the registered MCP server, and only the tools on its allowlist.
- Tool role (AgentCoreDBOpsRole): Used by the query tools Lambda function and the Gateway, with read access to the database secret. The Lambda function retrieves the credentials from Secrets Manager, so they never reach the agent.
- SQL Server login:
VIEW SERVER STATEandVIEW DATABASE STATEonly. The login can’t modify data, change schema, or end sessions.
Clean up
To avoid ongoing charges, follow the Cleanup steps in the README. First delete the skill and assets you uploaded, because they aren’t part of the stack. Then delete the dbops-devops-agent stack.
Conclusion
In this post, we showed how to connect SQL Server diagnostic tools to AWS DevOps Agent through Amazon Bedrock AgentCore Gateway. AWS DevOps Agent reads Amazon CloudWatch metrics, Database Insights, and AWS CloudTrail on its own. Your MCP tools behind the Gateway add what those services can’t show: blocking chains, Query Store history, execution plans, and index analysis. The agent skill tells the agent how to use both: check built-in data first and query SQL Server when the symptoms call for it. It then rates severity against your thresholds and reports the details your team needs to act.
We also covered two scenarios. In the first, an on-call engineer asked the agent for a quick health check in chat. In the second, an Amazon CloudWatch alarm started an investigation without anyone stepping in, and the agent found the root cause and recommended fixes.
To get started, clone the sample-agentic-db-ops-sqlserver repository and follow README.md. The same Gateway endpoint also works with the multi-agent system in the repository’s main deployment, and with other MCP clients that can authenticate to it.


