
Applications and AI workloads often put Amazon ElastiCache for Valkey on the critical path, so when latency rises, your users notice. When this happens, you need to find the cause fast: a slow command, a node nearing its memory or connection limit, or work spread unevenly across shards.
Amazon ElastiCache for Valkey, a fully managed caching service that delivers microsecond latency, recently launched four enhancements that help you find the cause faster. They build on OpenTelemetry and PromQL, open standards that you might already use with self-managed Valkey, and include:
- OpenTelemetry metrics. ElastiCache emits metrics directly from the engine and the host to Amazon CloudWatch in the OpenTelemetry format, with no exporter to deploy and no collector to run. You can filter and aggregate them by node, shard, command, or error type, and the core set, which covers the measurements most clusters need, comes at no additional charge.
- Detailed monitoring. A new monitoring mode that publishes any metric you select every 15 seconds, so you can catch short-lived events like latency spikes that a 60-second view smooths over.
- ElastiCache Insights. A prebuilt dashboard with no setup that shows cluster health across a Region at a glance, so you can spot a node nearing its memory, network, or connection limits.
- PromQL queries and alarms. With Prometheus Query Language (PromQL), you can rank nodes by traffic or forecast whether a node will reach its memory limit. One PromQL alarm watches every node in a cluster, even as you add or remove nodes, and shows you which node or shard breaches. The same queries run on the CloudWatch console and in Grafana.
In this post, you learn how to use these enhancements to find the cause when latency rises on a node-based Valkey cluster, and to catch the problem the next time. We follow one troubleshooting path: we turn on detailed monitoring, look for trouble in ElastiCache Insights, isolate a hot shard, query the metrics with PromQL, catch a short latency spike on one command, and create one alarm that watches every node. Then we run the same queries from Amazon Managed Grafana, review pricing, and clean up. We start with how standard and detailed monitoring differ, because the first step of the walkthrough is choosing which metrics to publish every 15 seconds.
Standard and detailed monitoring
ElastiCache now offers detailed monitoring, a new monitoring mode that publishes the metrics you select every 15 seconds, so you can catch problems shorter than a minute, such as a latency spike on one command. You can select from more than 100 metrics, 69 of which are only available in detailed monitoring. Standard monitoring stays on by default and works well when the core set, published every 60 seconds, covers what you need. CloudWatch Metrics (Classic) keep publishing in both modes, so your existing alarms and dashboards keep working:
| Standard monitoring | Detailed monitoring | |
| OpenTelemetry metrics | A core set | The core set, plus the metrics that you select from more than 100 |
| Interval | 60 seconds | 15 seconds for each selected metric, 60 seconds for the rest of the core set |
| CloudWatch Metrics (Classic) | Included | Included |
| How to turn on | On by default | The console, the AWS Command Line Interface (AWS CLI), the AWS SDKs, or AWS CloudFormation |
| Billing | No additional charge to publish. API queries and alarms are billed. | CloudWatch bills selected metrics by the datapoints they emit. API queries and alarms are billed. |
To see which metrics are emitted automatically and which attributes each one carries, see OpenTelemetry metrics reference for Amazon ElastiCache.
The following diagram shows how it works. Each node emits its metrics to CloudWatch, where the same data feeds ElastiCache Insights, PromQL queries and alarms, and, optionally, Amazon Managed Grafana.
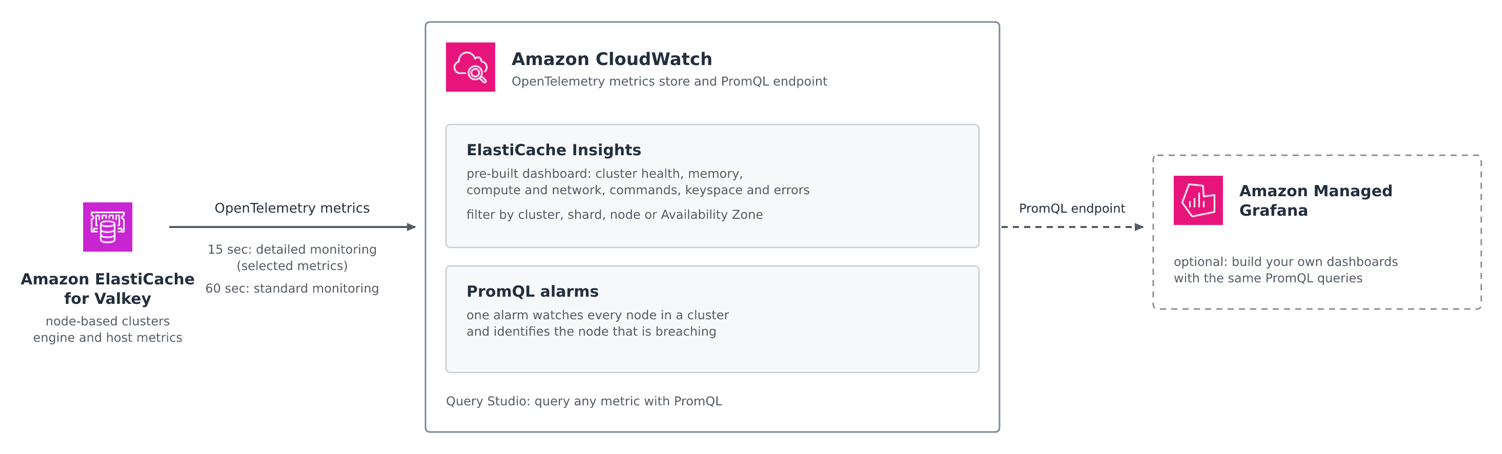
Figure 1: How the metrics flow from ElastiCache to CloudWatch and the tools that read them
Walkthrough
In this walkthrough, we use my-ec-cluster, a node-based Valkey cluster with three shards and one replica in each shard. The steps build on each other, so follow them in order. The last step, querying the metrics from Amazon Managed Grafana, is optional.
Prerequisites
To follow along, you need the following:
- A node-based Valkey cluster (a replication group in the API) on any Valkey version, in a Region where CloudWatch supports OpenTelemetry metrics. Clusters on AWS Outposts, Amazon ElastiCache Serverless caches, and Redis OSS and Memcached clusters publish only CloudWatch Metrics (Classic).
- AWS Command Line Interface (AWS CLI) version 2.37.2 or later for the CLI examples.
- AWS Identity and Access Management (IAM) permissions for the configuration, for PromQL queries (
cloudwatch:GetMetricDataandcloudwatch:ListMetrics), and for CloudWatch alarms and dashboards.
Detailed monitoring is a CloudWatch resource metrics configuration on the replication group’s Amazon Resource Name (ARN). To manage it, you need the cloudwatch:*ResourceMetricsConfiguration actions. These actions require "Resource": "*", so scope access with the cloudwatch:ResourceArn condition key. The examples use the placeholder account ID 123456789012 and the replication group ID my-ec-cluster. Replace both with your own values. Attach a policy like this one to the IAM principal that runs the CLI or uses the console:
Turn on detailed monitoring
You can turn on detailed monitoring on the ElastiCache console, with the AWS CLI or the AWS SDKs, or with the AWS::CloudWatch::ResourceMetricsConfiguration resource in AWS CloudFormation. This section shows the console and the CLI.
On the console, open your cluster, choose the Metrics tab, and then choose Detailed. Until you select metrics, the view shows No detailed metrics configured. Choose Configure detailed metrics, select the metrics you want, and choose Enable detailed metrics. After a few minutes, you can view the selected metrics on the Metrics tab. When you create a cluster, you can also choose Detailed monitoring in the Monitoring section.
With the AWS CLI, create the configuration and list the metrics by name. This example selects the two command metrics that we use in the latency example later in this post:
Both are core metrics, so selecting them moves them from 60 to 15 seconds and makes them billable while they stay selected. Select only the metrics that you need at 15 seconds.
To change the selection later, run update-resource-metrics-configuration and list every metric that you want, because a replication group has one configuration, and the new selection replaces the old one. In a global datastore, select metrics in each regional replication group.
Explore the ElastiCache Insights dashboard
ElastiCache Insights is a prebuilt CloudWatch dashboard that shows the health of your Valkey clusters across a Region at a glance, so you can see which cluster, shard, or node needs attention before you write a single query. It works without setup and at no charge. Open it from the Metrics tab of your cluster on the ElastiCache console by choosing View in ElastiCache Insights, or on the CloudWatch console under Infrastructure Monitoring > All Insights > ElastiCache Insights. Filter by narrows it to a cluster, shard, node, or Availability Zone, and Group by splits most charts by replication group, shard, node, Availability Zone, or role. You can also save a copy as a custom dashboard.
In Health Overview, the tiles show connected clients, client and memory utilization, cache hit rate, operations per second, and errors for your filter.

Figure 2: Health Overview
In Memory, the byte charts split primaries and replicas. Used Memory % and Capacity Used for Eviction % add a busiest-node line, the highest value of any node in each group, so watch them to see a node approach its limit before evictions begin.
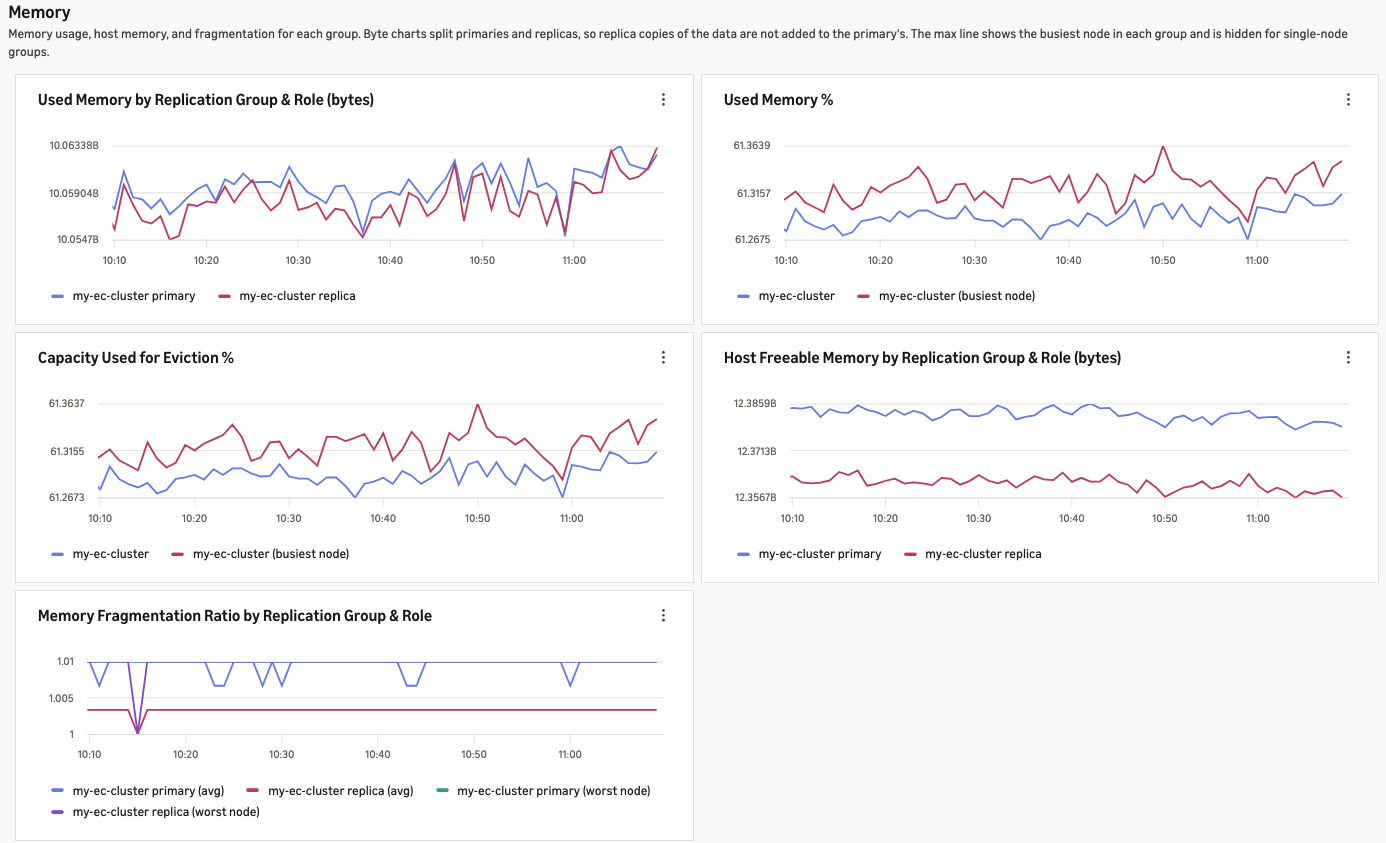
Figure 3: Memory
In Compute and network, CPU Utilization % (main thread), Network Baseline Usage %, and Connection Utilization % each carry a busiest-node line, so one hot node shows even when the group average looks healthy. Network Baseline Usage % also shows how close traffic is to the node’s baseline bandwidth, and Network Peak Usage % reads the per-second rates in the core set, so it catches a burst shorter than a minute.
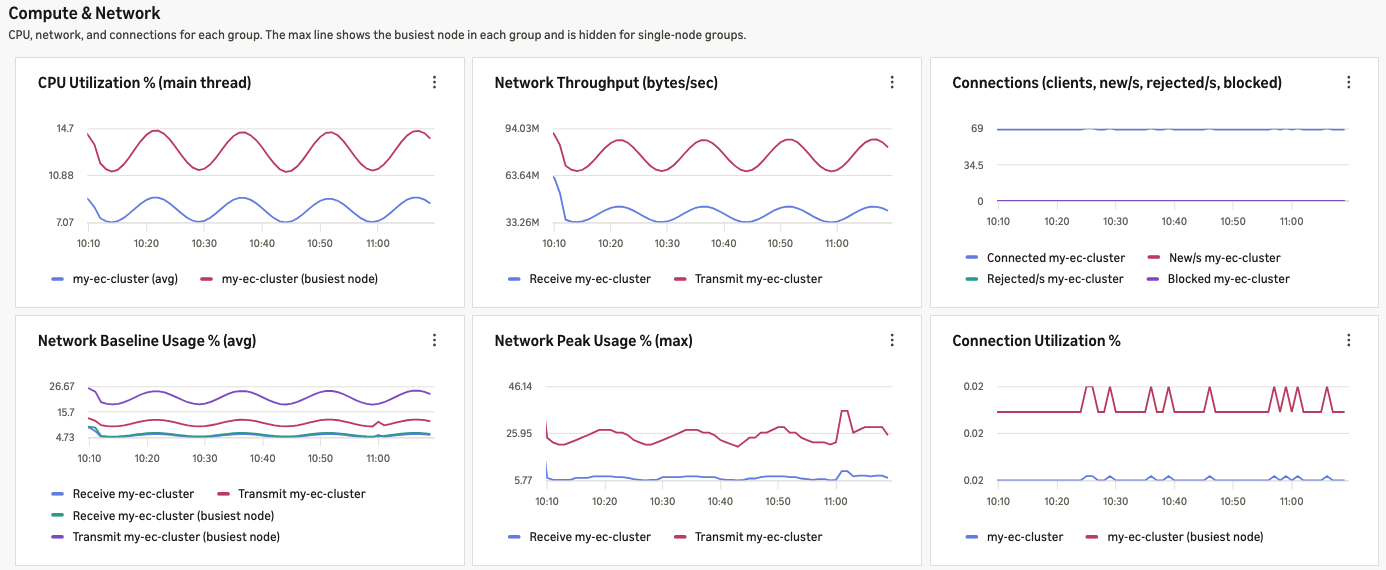
Figure 4: Compute and network
In Commands, keyspace, and errors, call rate and average latency by command make a slow command stand out, and the keyspace and error charts show hits and misses, evictions and expirations, and errors by type. At the default period, these charts compute rates over five minutes. For shorter spikes, see Catch a short latency spike later in this post.
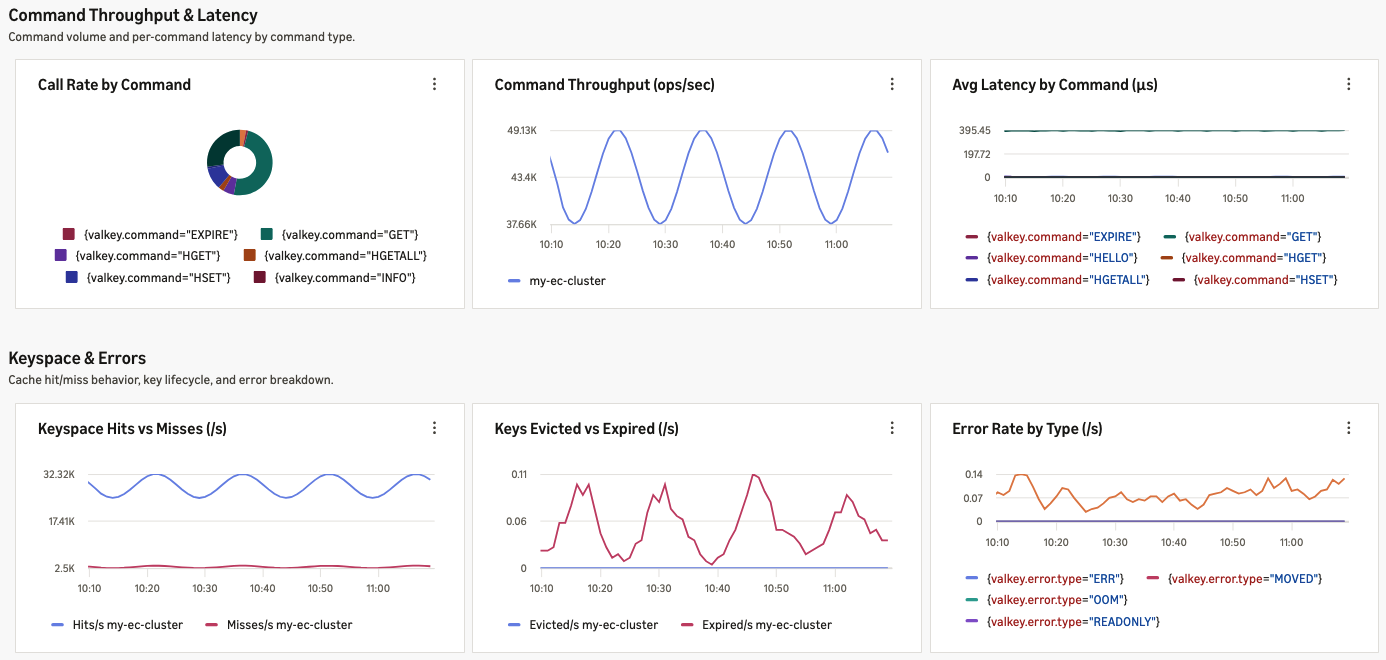
Figure 5: Commands, keyspace, and errors
Isolate a hot shard
Every datapoint carries its shard, so ElastiCache Insights can split most of its charts by shard with standard monitoring. To show this, we sent a burst of traffic to one shard of a three-shard cluster, my-ec-cluster, and recorded the Compute and network section with Group by set to Shard. The video compresses a ten-minute capture into 30 seconds.
Video 1: A traffic burst on one shard, grouped by shard
Partway through, CPU utilization on my-ec-cluster-0003 jumps while the other shards stay flat. The following screenshots show the same charts across the capture window and at the peak of the spike:
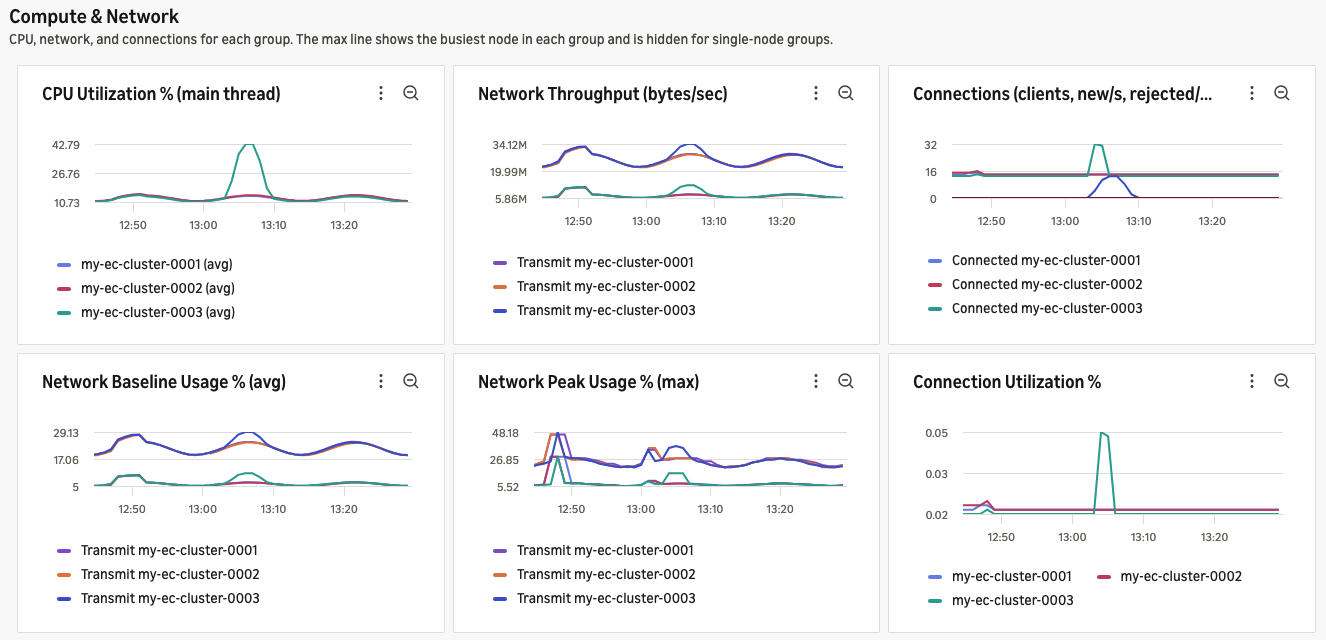
Figure 6: Compute and network grouped by shard across the capture window
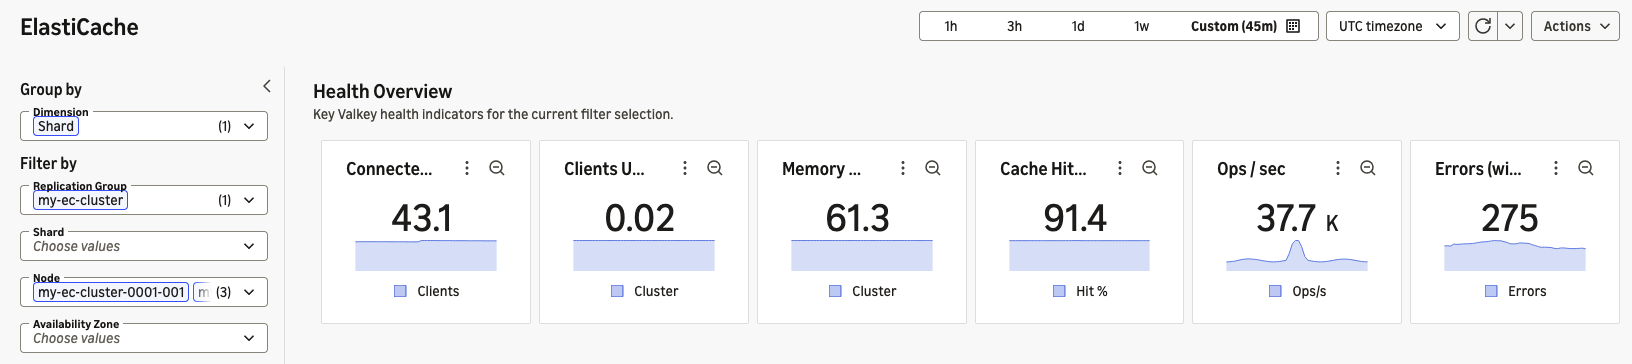
Figure 7: Compute and network grouped by shard at the peak of the spike
CPU Utilization for my-ec-cluster-0003 rises to about 42 percent, and the other shards stay at around 10 percent. By default, the dashboard groups charts by replication group. When you group them by shard instead, you get a specific shard, metric, and time window to act on.
Query the metrics with PromQL
To see which node in that shard is busiest, set Group by to Node. To go further, for example to rank nodes, combine metrics, or alarm on a condition, query the metrics with PromQL in Query Studio, dashboards, and alarms, or from any tool that reads the CloudWatch PromQL endpoint. To open Query Studio, in the navigation pane of the CloudWatch console, choose Metrics, Query Studio, and then choose PromQL in the query editor.
Quote metric and attribute names, because they contain dots. Resource attributes, such as the replication group, shard, and node, take the @resource. prefix, and datapoint attributes, such as valkey.role and valkey.command, take none.
Use a range that holds several datapoints: at least [5m] for metrics emitted every 60 seconds and at least [1m] for metrics emitted every 15 seconds, as the ElastiCache User Guide recommends. A query returns up to 500 series, so on a large cluster, aggregate or filter any query that breaks the results down by node and command.
To rank the nodes by bytes received per second, use topk. Each series that it returns carries the node and shard IDs:
Because topk ranks at query time, the nodes it returns change as your traffic shifts, and the query stays the same.
Memory used by each node, as a percentage of its limit:
Commands per second for each shard:
Catch a short latency spike
This is where detailed monitoring pays off. With the command metrics emitted every 15 seconds, a [1m] window keeps a 30-second latency spike visible. A [5m] window over 60-second data averages the same spike with minutes of normal traffic, and the spike can all but disappear. Average latency of each command, in microseconds:
Both metrics are cumulative for each command, so the ratio of their rates is the average duration of a call, and 1e6 converts seconds to microseconds. The > 0 keeps only the commands called during the window.
To see why 15-second resolution matters, we ran six short bursts of back-to-back LRANGE calls against a large list and queried the latency two ways. With a 1-minute window, each burst appears as its own spike, the largest peaking at about 1.5 ms, and latency drops back to its baseline of about 2.5 µs between bursts. With a 5-minute window, the shortest that standard monitoring’s 60-second datapoints support, the same bursts merge into one plateau of about 300 to 600 µs. From the 5-minute view alone, you would see a few minutes of moderately raised latency. The 1-minute view shows six separate events with recovery in between. Both charts use a logarithmic y-axis, so the baseline and the spikes fit on the same scale.
For the following figure, we filtered the same query to GET and LRANGE with "valkey.command"=~"GET|LRANGE", and ran it with a 1-minute and a 5-minute window. To add the filter, put "valkey.command"=~"GET|LRANGE" inside the braces of both selectors, after the replication group matcher. =~ compares the label to a regular expression, so the query keeps only GET and LRANGE.
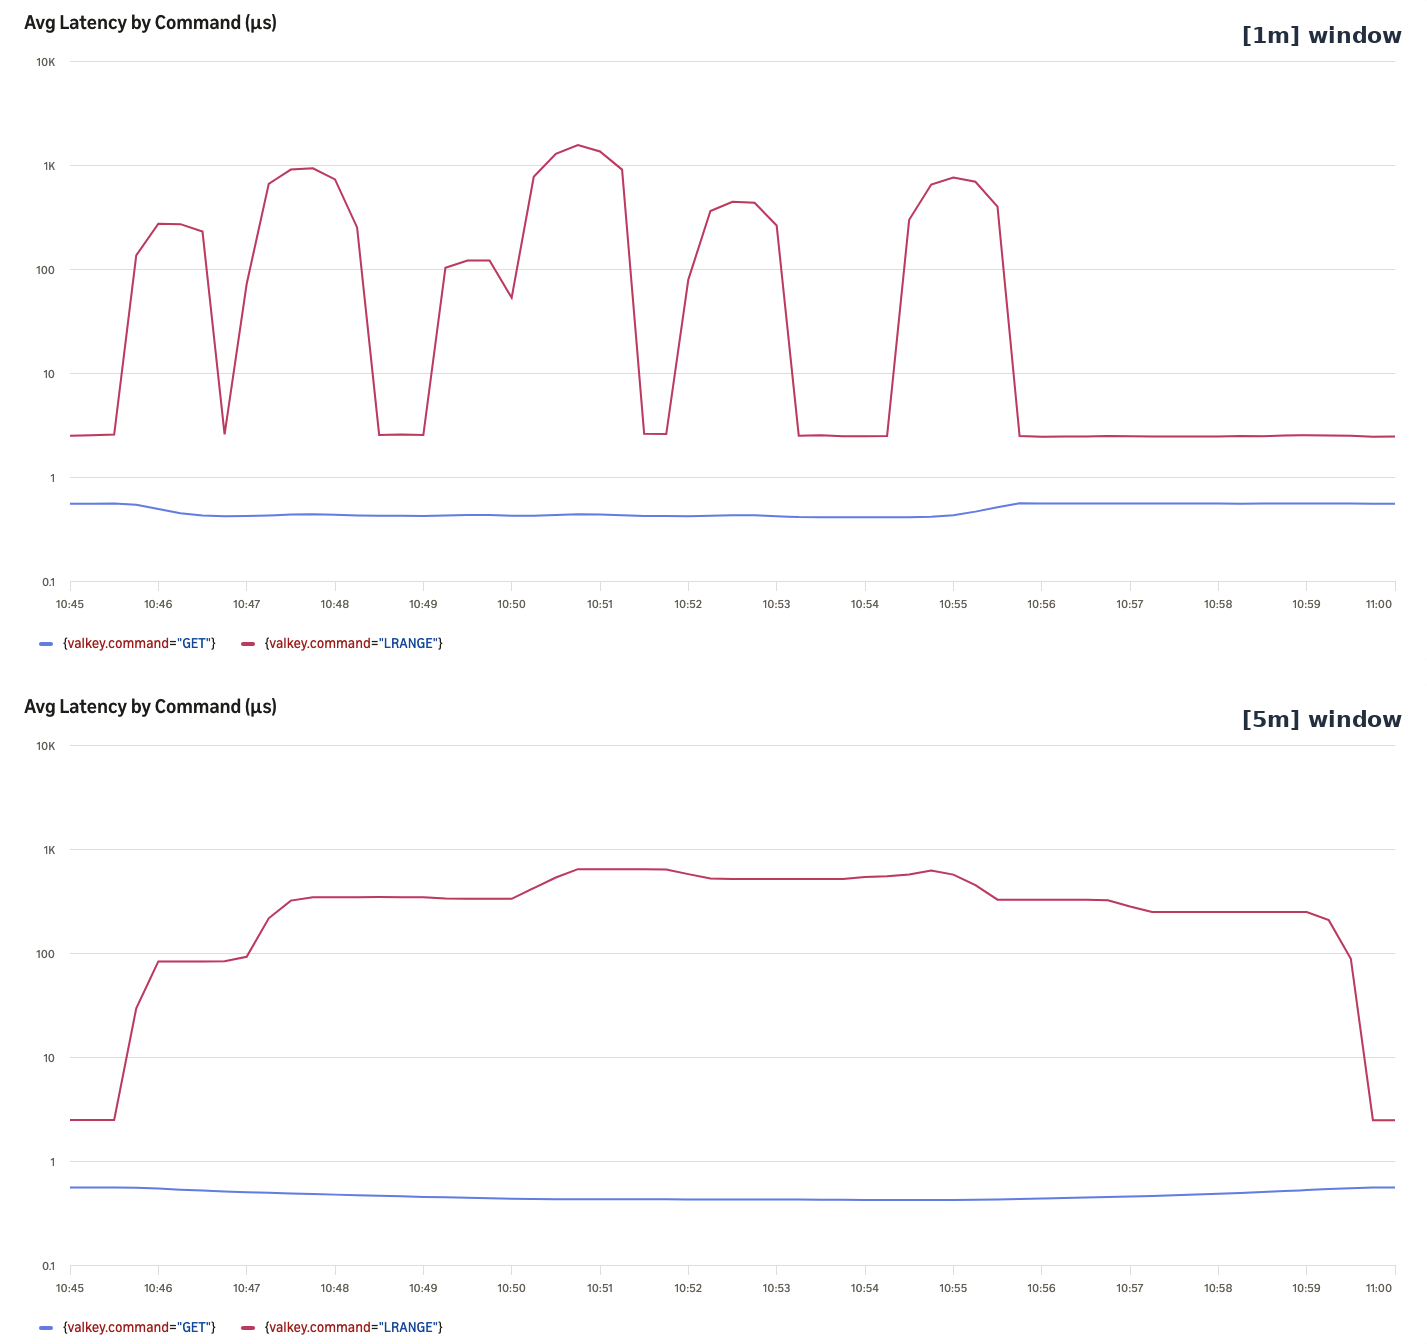
Figure 8: The same LRANGE bursts queried with a 1-minute window (top) and a 5-minute window (bottom)
Create one alarm that watches every node
Put the threshold in the query, and the query returns a series only for the nodes that breach it. This query returns a series for each node above 90 percent of its memory limit:
CloudWatch tracks each returned series as a contributor and moves the alarm to ALARM when any contributor has breached for the pending period, and the attributes of that series name the node. One alarm covers every node in the cluster, even as you add or remove nodes. Save the criteria in alarm.json so that you don’t need to escape the query for the shell:
The evaluation interval sets how often the query runs. It can be 10, 20, or 30 seconds, or a multiple of 60 seconds up to one hour. Set it to at least the interval at which ElastiCache emits the metric. That means 60 seconds or longer for a core metric, and 20 seconds or longer for a metric that you selected, which ElastiCache emits every 15 seconds. The pending period is how long a node must breach continuously before the alarm fires, five minutes here. The recovery period is how long a node must stop breaching before it returns to OK, ten minutes here.
The ElastiCache User Guide has more than 60 ready-to-use queries in Example queries for common monitoring tasks. One uses predict_linear to project each node’s memory use an hour ahead from the trend of the last hour. Append a comparison, such as > 100, and the query becomes an alarm that can warn you before a node reaches its memory limit. For more on PromQL in CloudWatch, see Query metrics with PromQL in the Amazon CloudWatch User Guide.
Query the metrics from Amazon Managed Grafana
If your team builds dashboards in Amazon Managed Grafana, you can chart these metrics with the same PromQL queries. Workspaces on Grafana version 13 or later query CloudWatch with PromQL through the CloudWatch data source. With service-managed permissions, adding CloudWatch through the AWS data sources configuration grants the workspace role cloudwatch:GetMetricData and cloudwatch:ListMetrics. PromQL queries need both permissions. Then add a panel and choose the CloudWatch data source and the PromQL query type. Switch the editor to Code, choose your cluster’s Region, and paste any query from the previous sections. For a workspace on Grafana version 12.4, use an Amazon Managed Service for Prometheus data source instead, as described in Grafana integration in the Amazon CloudWatch User Guide.
The following screenshot shows an Amazon Managed Grafana dashboard that queries ElastiCache metrics with PromQL.
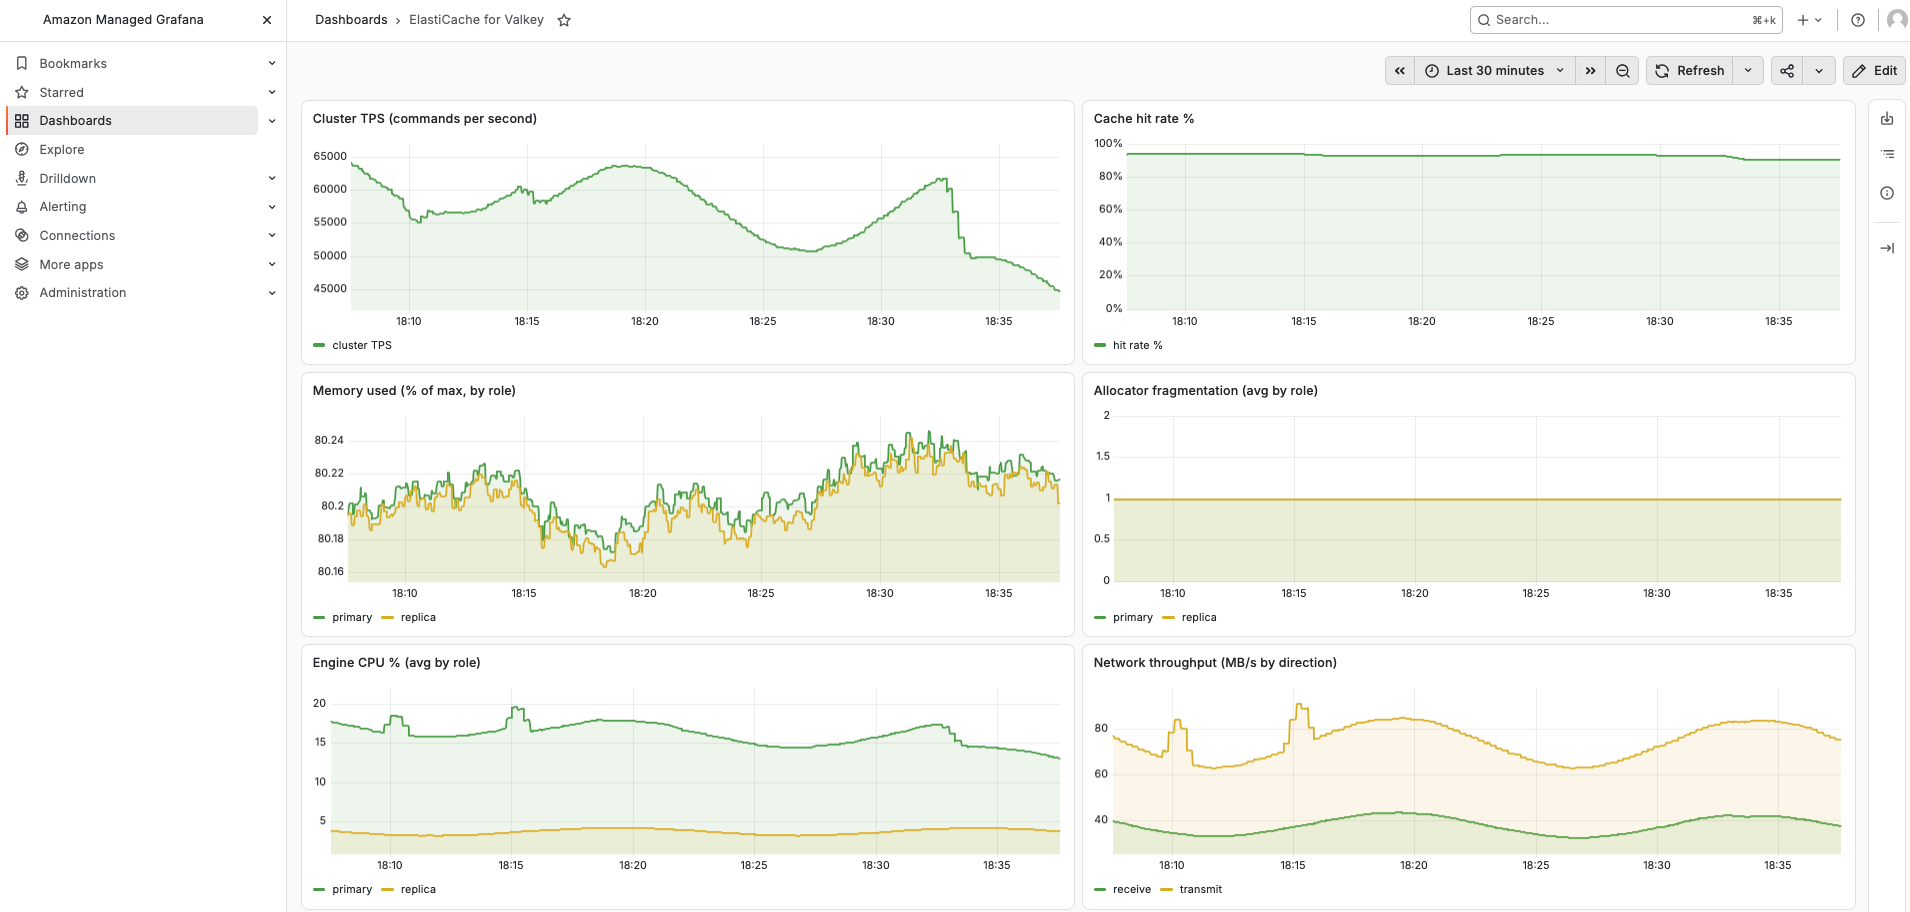
Figure 9: An Amazon Managed Grafana dashboard that queries ElastiCache metrics with PromQL
Pricing
ElastiCache publishes the core metrics at no additional charge. You pay for the metrics that you select for detailed monitoring, including any core metrics, by the volume of datapoints they emit, not by the number of metrics:
- At 15 seconds, each selected metric emits four datapoints a minute from every node in the replication group.
- A metric broken down by an attribute emits a datapoint for each value. For example,
valkey.command.callsemits one for each command, so its cost grows with the number of distinct commands your workload runs. - If you omit
--metric-selections, orMetricSelectionsin CloudFormation, the configuration selects every available metric, and you pay for all of them.
For example, suppose that you select the two metrics from this post, valkey.command.duration and valkey.command.calls, on a replication group in US East (N. Virginia) with three shards and one replica in each shard, six nodes in all, and each node reports 10 distinct commands (such as GET, SET, and HGET). That is 120 series (2 metrics × 10 commands × 6 nodes). At four datapoints a minute, they emit 20,736,000 datapoints in a 30-day month. Assuming 500 bytes per datapoint, that is 10.37 GB ingested, or $5.18 a month at $0.50 per GB. The rest of the core set stays at 60 seconds at no additional charge.
PromQL queries on the CloudWatch console, including dashboards and Query Studio, are available at no cost. When you query through the CloudWatch API, including from Grafana, you pay for the samples each query scans. You also pay for each PromQL alarm and for the samples each evaluation scans. ElastiCache Insights is available at no cost, and a saved copy costs the same as any other custom dashboard. For rates, see Amazon CloudWatch pricing.
Clean up
To stop the 15-second metrics and their charges, delete the configuration. The core metrics continue at 60 seconds, and CloudWatch Metrics (Classic) are unaffected.
You pay for the alarm and any saved copy of the dashboard until you delete them:
Delete any cluster or Amazon Managed Grafana workspace that you created for this walkthrough. Deleting a replication group also deletes its metrics configuration.
Conclusion
With OpenTelemetry metrics, Amazon ElastiCache for Valkey gives you a per-shard and per-node view of your node-based clusters in CloudWatch, built on open standards and with no exporter to deploy and no collector to run. When latency rises, ElastiCache Insights shows you where to look, and PromQL ranks your nodes, finds the slow command, and forecasts whether a node will reach its memory limit. One alarm watches every node for the next problem, and detailed monitoring adds 15-second metrics for spikes shorter than a minute. ElastiCache publishes the core set at no additional charge, ElastiCache Insights is available at no cost, and you can run the same queries in Grafana.
You can use these new enhancements with node-based Valkey clusters in the AWS Regions where Amazon CloudWatch supports OpenTelemetry metrics. CloudWatch pricing applies to the detailed monitoring metrics you select, the alarms you create, and the PromQL API queries you run.
To get started, open the Metrics tab of one of your Valkey clusters and choose View in ElastiCache Insights. When you need a metric outside the core set, or need to catch a short-lived event such as a latency spike, choose Detailed and select the few metrics that matter most for your workload. To learn more, see Monitoring ElastiCache with OpenTelemetry metrics in the Amazon ElastiCache User Guide.


